Technical Analysis of PTIN 2024-05-10
Overview:
In analyzing the technical indicators for PTIN over the last 5 days, we will delve into the trend, momentum, volatility, and volume indicators to provide a comprehensive outlook on the possible stock price movement. By examining these key aspects, we aim to offer valuable insights and predictions for the upcoming days.
Trend Analysis:
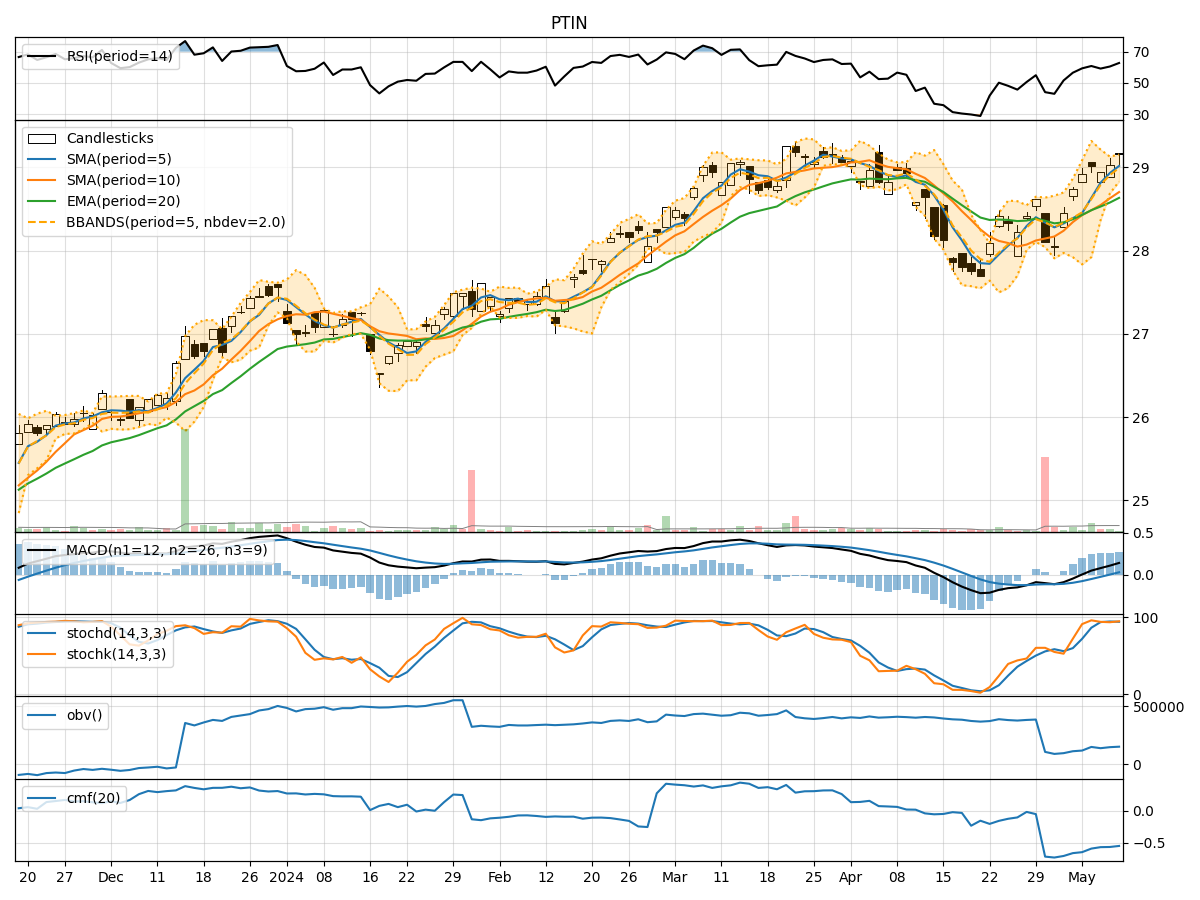
- Moving Averages (MA): The 5-day Moving Average (MA) has been consistently above the Simple Moving Average (SMA) and Exponential Moving Average (EMA), indicating a bullish trend.
- MACD: The MACD line has been consistently above the signal line, with both lines showing an upward trend, suggesting bullish momentum.
Momentum Analysis:
- RSI: The Relative Strength Index (RSI) has been trending upwards, indicating increasing buying pressure.
- Stochastic Oscillator: Both %K and %D lines of the Stochastic Oscillator are in the overbought zone, suggesting a potential reversal or consolidation.
Volatility Analysis:
- Bollinger Bands (BB): The stock price has been consistently trading above the middle Bollinger Band (BBM), indicating an uptrend. The bands are narrowing, suggesting a potential decrease in volatility.
Volume Analysis:
- On-Balance Volume (OBV): The OBV has been declining, indicating a decrease in buying pressure.
- Chaikin Money Flow (CMF): The CMF has been negative, suggesting a lack of buying interest.
Key Observations:
- The trend indicators suggest a strong bullish sentiment in the short term.
- Momentum indicators show signs of overbought conditions, indicating a potential reversal or consolidation.
- Volatility is decreasing, which may lead to a period of consolidation or a minor pullback.
- Volume indicators reflect a decrease in buying pressure, which could impact the stock's upward momentum.
Conclusion:
Based on the analysis of the technical indicators, the next few days for PTIN could see a potential consolidation or minor pullback in the stock price. While the trend remains bullish, the overbought momentum and declining buying pressure suggest a temporary pause in the upward movement. Traders should be cautious of a possible reversal or sideways movement in the coming days.