Technical Analysis of PTBD 2024-05-10
Overview:
In analyzing the technical indicators for PTBD stock over the last 5 days, we will delve into the trend, momentum, volatility, and volume indicators to provide a comprehensive assessment of the stock's potential price movement. By examining these key factors, we aim to offer valuable insights and predictions for the next few days.
Trend Indicators:
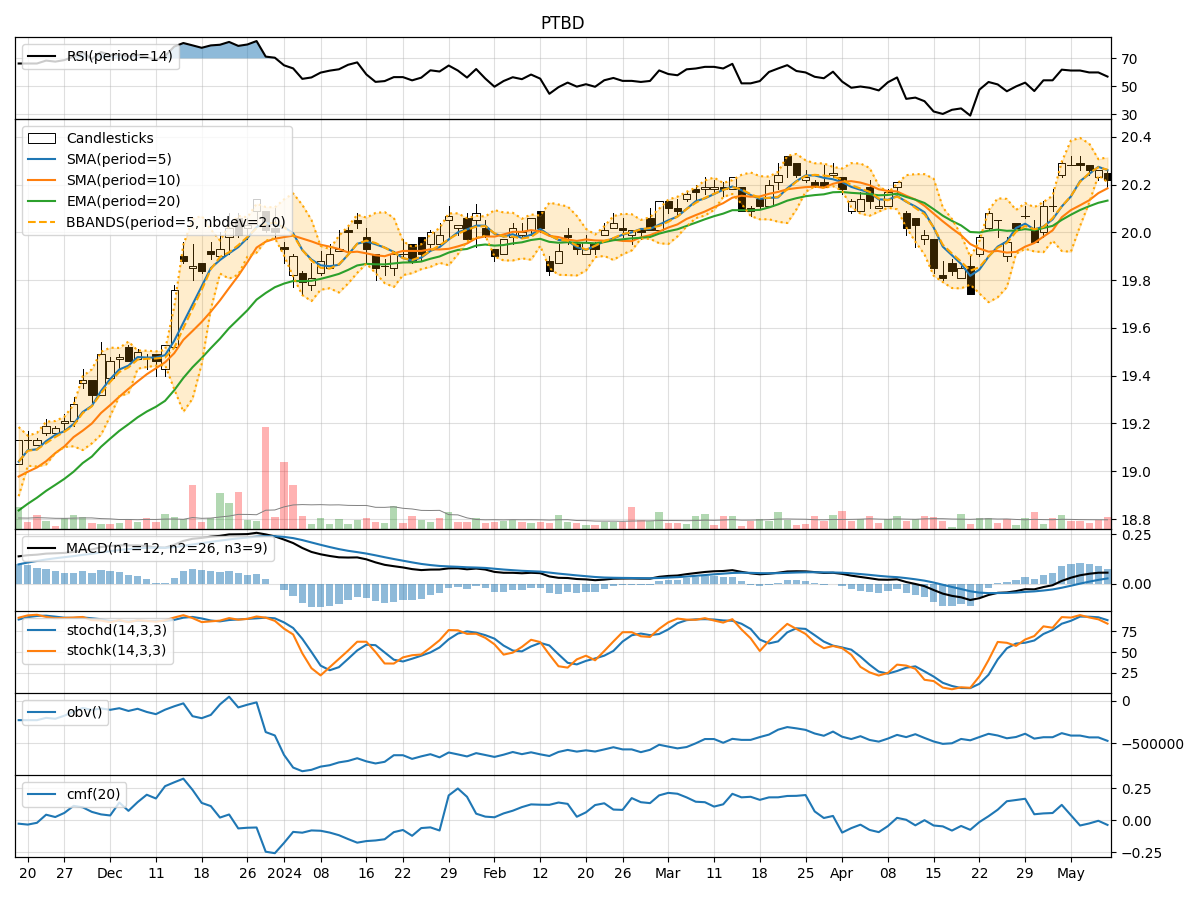
- Moving Averages (MA): The 5-day Moving Average (MA) has been consistently above the Simple Moving Average (SMA) and Exponential Moving Average (EMA), indicating a short-term uptrend.
- MACD: The MACD line has been consistently above the signal line, with the MACD Histogram showing positive values, suggesting bullish momentum.
Momentum Indicators:
- RSI: The Relative Strength Index (RSI) has been fluctuating around the 60-70 range, indicating a neutral momentum.
- Stochastic Oscillator: Both %K and %D have been gradually decreasing, signaling a potential bearish momentum shift.
Volatility Indicators:
- Bollinger Bands (BB): The stock price has been trading within the Bollinger Bands, with the bands narrowing, suggesting decreasing volatility.
Volume Indicators:
- On-Balance Volume (OBV): The OBV has been declining, indicating a potential distribution phase.
- Chaikin Money Flow (CMF): The CMF has been negative, reflecting selling pressure in the stock.
Key Observations:
- The trend indicators suggest a short-term uptrend in the stock price.
- Momentum indicators show a neutral to slightly bearish sentiment.
- Volatility has been decreasing, indicating a potential consolidation phase.
- Volume indicators point towards distribution and selling pressure in the stock.
Conclusion:
Based on the analysis of the technical indicators, the next few days' possible stock price movement for PTBD is likely to experience a consolidation phase with a slight bearish bias. Traders should exercise caution and consider potential downside risks in their trading strategies. It is advisable to closely monitor key support levels and wait for clearer signals before making significant trading decisions.