Technical Analysis of PSP 2024-05-10
Overview:
In analyzing the technical indicators for PSP stock over the last 5 days, we will delve into the trend, momentum, volatility, and volume indicators to provide a comprehensive assessment of the possible stock price movement in the coming days. By examining these key indicators, we aim to offer valuable insights and predictions for potential investors.
Trend Indicators:
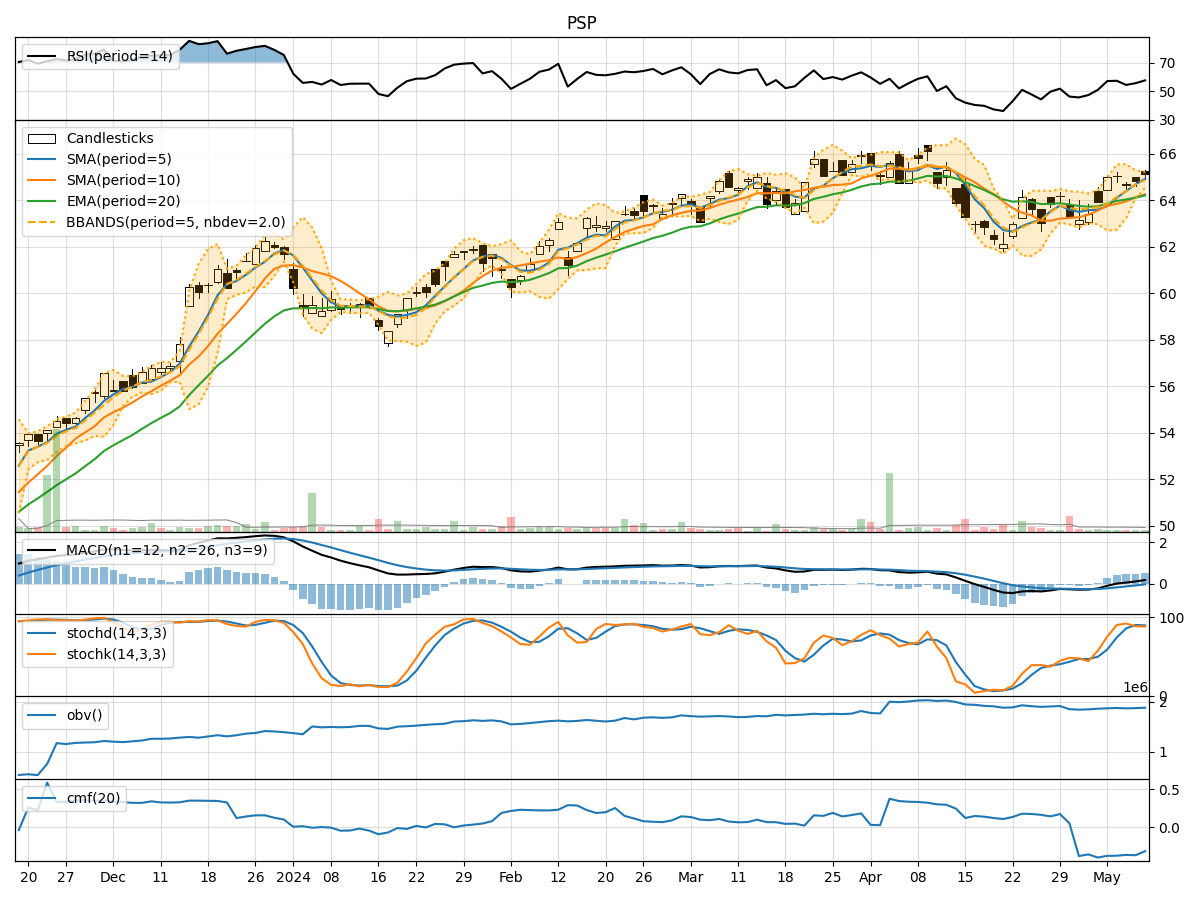
- Moving Averages (MA): The 5-day moving average has been consistently above the closing prices, indicating a short-term uptrend.
- MACD: The MACD line has been positive and increasing, suggesting bullish momentum.
- RSI: The RSI values have been fluctuating around the overbought territory, indicating potential strength in the current uptrend.
Momentum Indicators:
- Stochastic Oscillator: Both %K and %D values have been relatively high, signaling strong buying pressure.
- Williams %R: The values have been hovering in the oversold region, indicating a potential reversal to the upside.
Volatility Indicators:
- Bollinger Bands: The price has been trading within the bands, suggesting a period of consolidation.
- Volatility: The volatility has been decreasing, indicating a possible stabilization in price movements.
Volume Indicators:
- On-Balance Volume (OBV): The OBV has been fluctuating, indicating mixed buying and selling pressure.
- Chaikin Money Flow (CMF): The CMF values have been negative, suggesting outflow of money from the stock.
Key Observations:
- The trend indicators show a bullish bias with positive MACD and RSI values.
- Momentum indicators suggest strong buying pressure but also hint at a potential reversal.
- Volatility indicators point towards a period of consolidation and stabilization.
- Volume indicators reflect mixed sentiment with fluctuating OBV and negative CMF values.
Conclusion:
Based on the analysis of the technical indicators, the stock price of PSP is likely to continue its upward momentum in the next few days. The bullish trend, supported by positive MACD and RSI values, indicates potential for further price appreciation. However, caution is advised as momentum indicators hint at a possible reversal, and volume indicators show mixed sentiment. Traders should closely monitor price movements and key support/resistance levels for timely decision-making.