Technical Analysis of PSMJ 2024-05-10
Overview:
In analyzing the technical indicators for PSMJ stock over the last 5 days, we will delve into the trend, momentum, volatility, and volume indicators to provide a comprehensive outlook on the possible stock price movement in the coming days. By examining key metrics such as moving averages, MACD, RSI, Bollinger Bands, and OBV, we aim to offer valuable insights and predictions for potential price trends.
Trend Indicators:
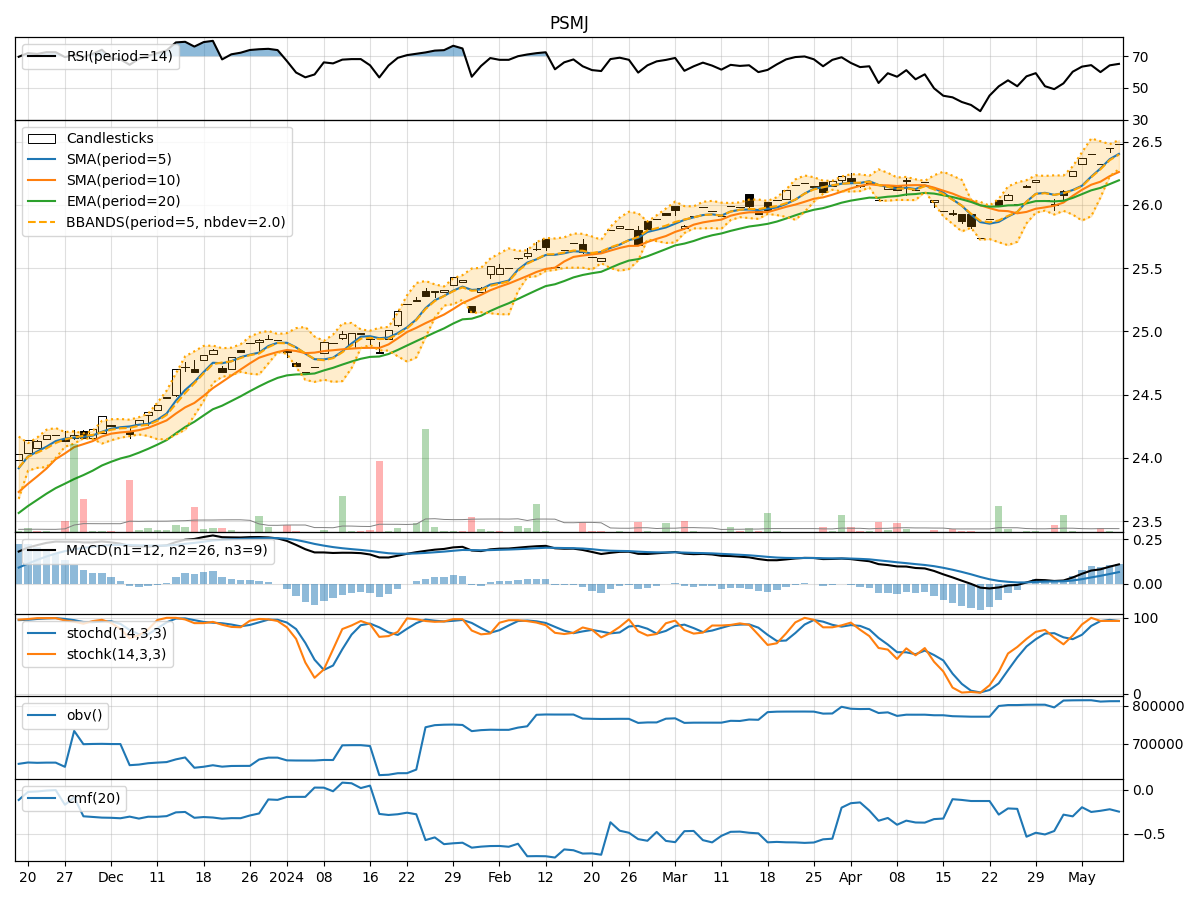
- Moving Averages (MA): The 5-day MA has been consistently above the closing prices, indicating a short-term uptrend.
- MACD: The MACD line has been trending upwards, with the MACD histogram showing positive values, suggesting bullish momentum.
- EMA: The EMA has been steadily increasing, reflecting a positive trend in the stock price.
Momentum Indicators:
- RSI: The RSI values have been in the overbought territory, indicating strong buying momentum.
- Stochastic Oscillator: Both %K and %D values have been high, suggesting a continuation of the bullish momentum.
- Williams %R: The Williams %R values have been hovering around 0, indicating a potential overbought condition.
Volatility Indicators:
- Bollinger Bands: The stock price has been trading within the upper Bollinger Band, indicating an overbought condition.
- Bollinger Band Width: The Band Width has been narrowing, suggesting a potential decrease in volatility.
- Bollinger Band %B: The %B value has been above 0.8, indicating an overbought condition.
Volume Indicators:
- On-Balance Volume (OBV): The OBV values have been fluctuating, indicating mixed buying and selling pressure.
- Chaikin Money Flow (CMF): The CMF values have been negative, suggesting a lack of buying interest in the stock.
Key Observations:
- The stock is currently in an upward trend based on moving averages and MACD.
- Momentum indicators suggest overbought conditions and strong buying momentum.
- Volatility indicators point towards an overbought condition and a potential decrease in volatility.
- Volume indicators show mixed buying and selling pressure with a lack of significant buying interest.
Conclusion:
Based on the analysis of technical indicators, the next few days' possible stock price movement for PSMJ is likely to be sideways to slightly bearish. The stock is currently exhibiting signs of being overbought, and with mixed volume indicators, we may see a period of consolidation or a slight pullback in the stock price. Traders should exercise caution and consider potential profit-taking opportunities in the short term.