Technical Analysis of PSI 2024-05-10
Overview:
In analyzing the technical indicators for PSI stock over the last 5 days, we will delve into the trends, momentum, volatility, and volume aspects to provide a comprehensive outlook on the possible stock price movement in the coming days.
Trend Analysis:
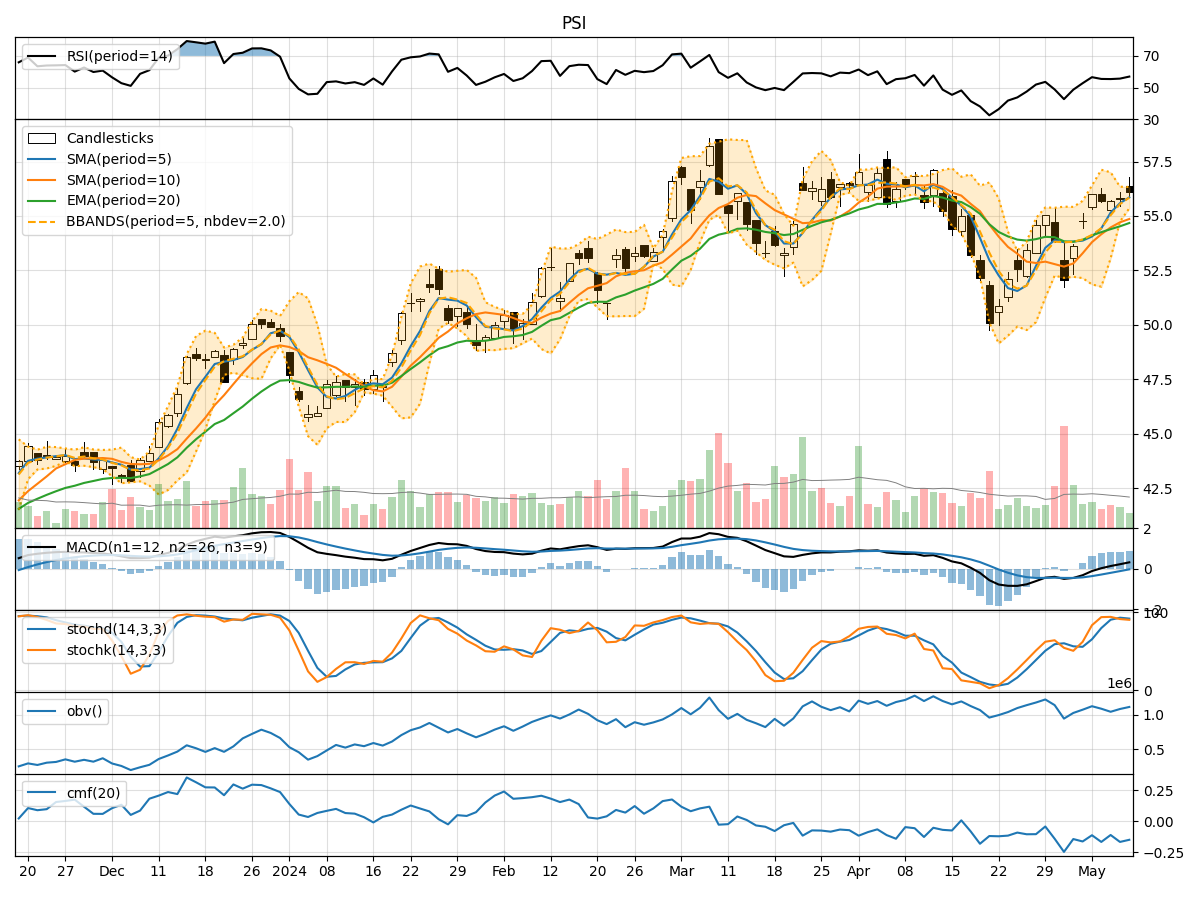
- Moving Averages (MA): The 5-day Moving Average (MA) has been consistently above the Simple Moving Average (SMA) and Exponential Moving Average (EMA), indicating a bullish trend.
- MACD: The MACD line has been consistently above the signal line, with both lines showing an upward trend, suggesting bullish momentum.
- MACD Histogram: The MACD Histogram has been increasing over the past 5 days, indicating strengthening bullish momentum.
Momentum Analysis:
- RSI: The Relative Strength Index (RSI) has been in the overbought territory, indicating a strong bullish momentum.
- Stochastic Oscillator: Both %K and %D lines of the Stochastic Oscillator have been in the overbought zone, suggesting a strong bullish momentum.
- Williams %R: The Williams %R has been consistently in the oversold region, indicating a strong bullish sentiment.
Volatility Analysis:
- Bollinger Bands (BB): The stock price has been consistently trading above the middle Bollinger Band (BBM), indicating an upward trend.
- Bollinger Band Width (BBW): The Bollinger Band Width has been narrowing, suggesting decreasing volatility.
- Bollinger Band %B (BBP): The %B indicator has been above 0.5, indicating an uptrend.
Volume Analysis:
- On-Balance Volume (OBV): The OBV has been showing a positive trend, indicating accumulation by investors.
- Chaikin Money Flow (CMF): The CMF has been negative, suggesting some selling pressure in the stock.
Key Observations:
- The technical indicators across trend, momentum, and volatility suggest a strong bullish sentiment in the stock.
- The volume indicators show a mixed picture with OBV indicating accumulation but CMF showing selling pressure.
Conclusion:
Based on the analysis of the technical indicators, the stock is likely to continue its upward momentum in the coming days. The bullish trend supported by strong momentum and decreasing volatility indicates a potential for further price appreciation. Investors may consider buying opportunities in the stock based on the current technical outlook.