Technical Analysis of PSFJ 2024-05-10
Overview:
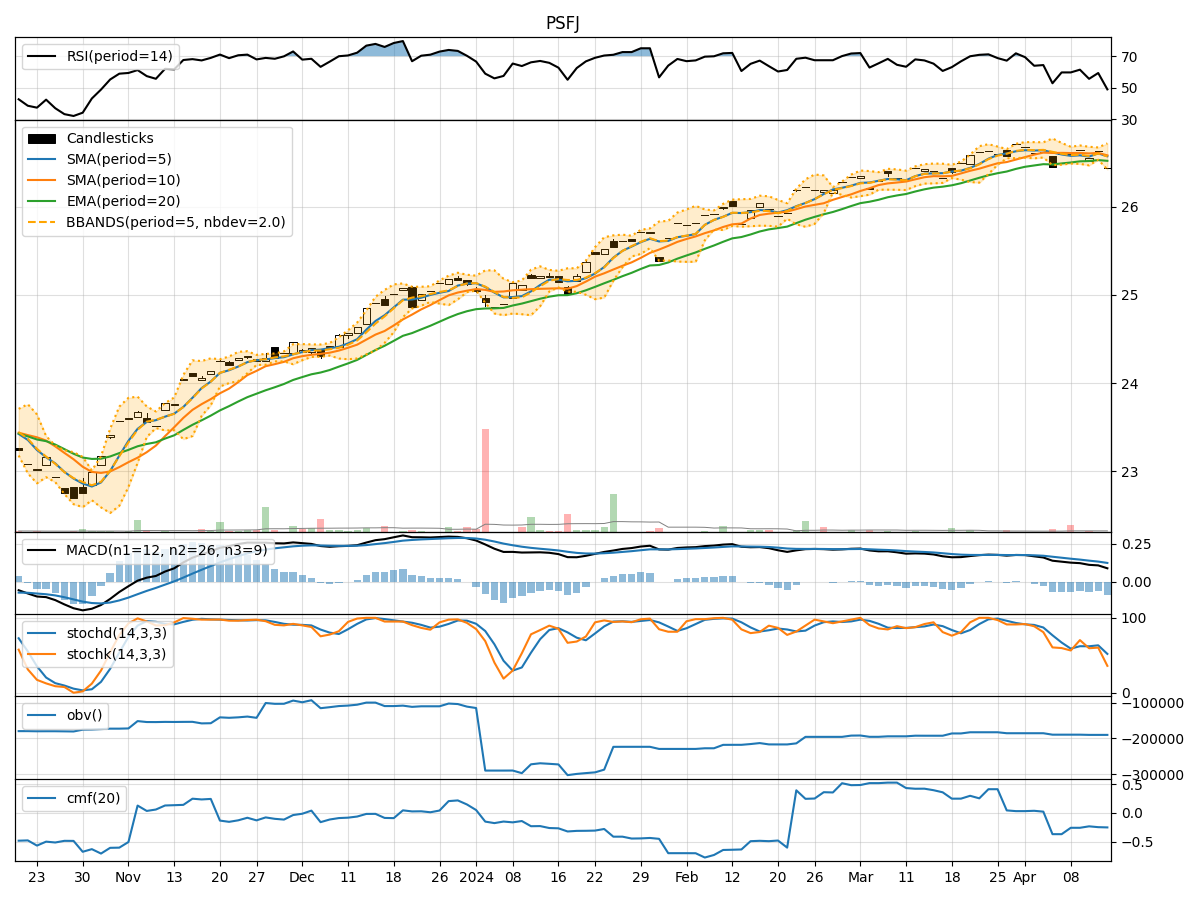
In analyzing the technical indicators for PSFJ stock over the last 5 days, we will delve into the trends, momentum, volatility, and volume indicators to provide a comprehensive outlook on the possible stock price movement in the coming days. By examining key metrics such as moving averages, MACD, RSI, Bollinger Bands, and OBV, we aim to offer valuable insights and predictions for potential price action.
Trend Indicators:
- Moving Averages (MA): The 5-day MA has been consistently rising, indicating a bullish trend in the short term.
- MACD: The MACD line has been above the signal line, suggesting positive momentum.
- EMA: The EMA has been trending upwards, supporting the bullish sentiment.
Key Observation: The trend indicators point towards an upward movement in the stock price.
Momentum Indicators:
- RSI: The RSI has been increasing, showing strengthening momentum.
- Stochastic Oscillator: Both %K and %D have been high, indicating strong buying pressure.
- Williams %R: The indicator is close to oversold levels, suggesting a potential reversal.
Key Observation: Momentum indicators signal a bullish sentiment in the stock.
Volatility Indicators:
- Bollinger Bands: The stock price has been trading within the bands, indicating normal volatility.
- Bollinger %B: The %B is close to 1, suggesting the price is near the upper band.
Key Observation: Volatility is within normal levels, with a slight indication of a bullish bias.
Volume Indicators:
- On-Balance Volume (OBV): The OBV has been relatively stable, showing no significant divergence.
- Chaikin Money Flow (CMF): The CMF has been negative, indicating selling pressure.
Key Observation: Volume indicators suggest a neutral stance with a slight bearish bias.
Conclusion:
Based on the analysis of trend, momentum, volatility, and volume indicators, the overall outlook for PSFJ stock in the next few days is bullish. The trend is upward, momentum is strong, volatility is normal with a bullish bias, and volume is relatively neutral with a slight bearish tilt. Therefore, it is likely that the stock price will continue its upward trajectory in the coming days. Traders and investors may consider buying opportunities in PSFJ stock based on the technical analysis provided.