Technical Analysis of PSFD 2024-05-10
Overview:
In analyzing the technical indicators for PSFD over the last 5 days, we will delve into the trend, momentum, volatility, and volume indicators to provide a comprehensive outlook on the possible stock price movement in the coming days. By examining these key aspects, we aim to offer valuable insights and predictions to guide your investment decisions.
Trend Analysis:
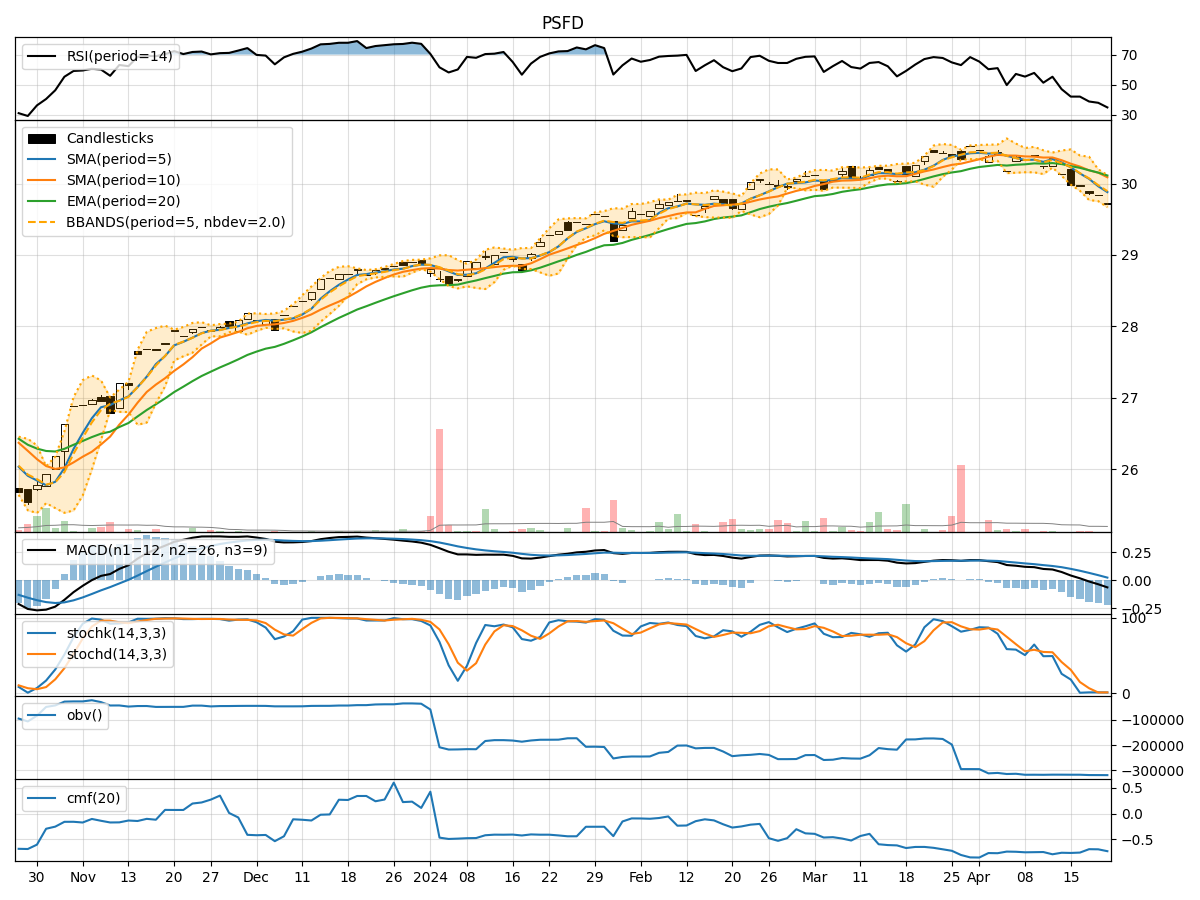
- Moving Averages (MA): The 5-day Moving Average (MA) has been consistently above the Simple Moving Average (SMA) and Exponential Moving Average (EMA), indicating a bullish trend.
- MACD: The MACD line has been consistently above the signal line, with the MACD Histogram showing an increasing positive trend, suggesting bullish momentum.
Momentum Analysis:
- RSI: The Relative Strength Index (RSI) has been trending upwards, indicating increasing buying pressure and potential overbought conditions.
- Stochastic Oscillator: Both %K and %D lines of the Stochastic Oscillator have been in the overbought zone, suggesting a potential reversal or consolidation.
Volatility Analysis:
- Bollinger Bands (BB): The stock price has been trading within the Bollinger Bands, with the bands narrowing, indicating decreasing volatility.
- Bollinger %B: The %B indicator has been hovering around 0.8, suggesting the stock is trading near the upper band.
Volume Analysis:
- On-Balance Volume (OBV): The OBV has been fluctuating, indicating indecision among investors regarding the stock.
- Chaikin Money Flow (CMF): The CMF has been negative, suggesting selling pressure in the stock.
Key Observations:
- The trend indicators point towards a bullish sentiment, supported by the MACD and moving averages.
- Momentum indicators show potential overbought conditions, signaling a need for caution.
- Volatility indicators suggest decreasing price fluctuations, possibly leading to a period of consolidation.
- Volume indicators reflect mixed investor sentiment, with selling pressure indicated by the CMF.
Conclusion:
Based on the analysis of the technical indicators, the stock is likely to experience a period of consolidation in the coming days. While the bullish trend is supported by the moving averages and MACD, the overbought conditions and negative CMF signal caution. Investors should closely monitor the price action for potential signs of a reversal or continuation of the current trend. It is advisable to wait for clearer signals before making significant trading decisions.