Technical Analysis of PSEP 2024-05-10
Overview:
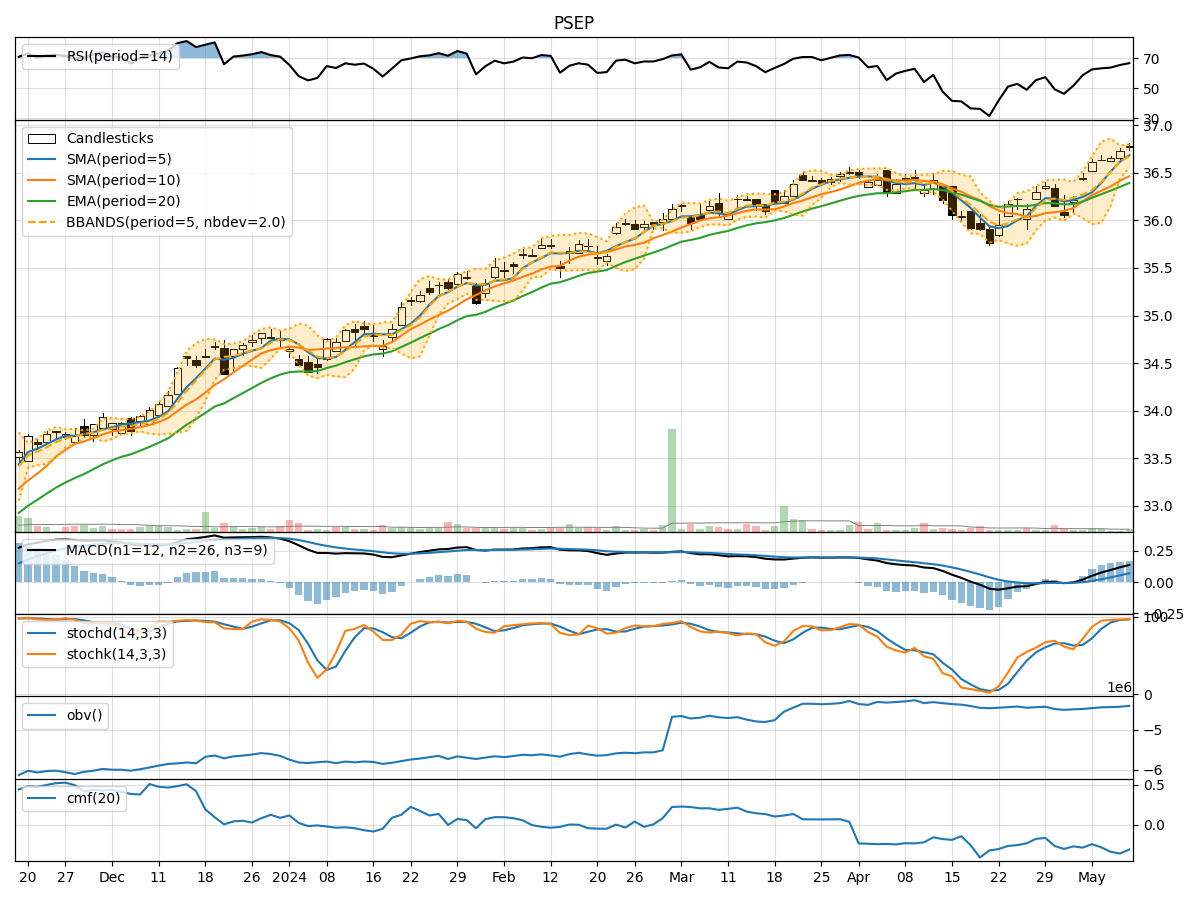
In the last 5 trading days, the stock price of PSEP has shown a gradual increase with fluctuating volumes. The trend indicators suggest a positive momentum, supported by increasing moving averages and MACD values. Momentum indicators like RSI and Stochastic oscillators indicate overbought conditions but still show strength in the current trend. Volatility indicators suggest a narrowing of the Bollinger Bands, indicating potential price consolidation. Volume indicators show a slight increase in On-Balance Volume (OBV) but a negative Chaikin Money Flow (CMF), indicating some distribution.
Trend Indicators Analysis:
- Moving Averages (MA): The 5-day MA has been consistently above the 10-day SMA, indicating a short-term bullish trend.
- MACD: The MACD line has been above the signal line, showing positive momentum.
- EMA: The EMA values have been increasing, supporting the uptrend.
Momentum Indicators Analysis:
- RSI: The RSI values are in the overbought territory, suggesting a potential reversal or consolidation.
- Stochastic Oscillators: Both %K and %D values are in the overbought zone, indicating a possible pullback.
Volatility Indicators Analysis:
- Bollinger Bands (BB): The narrowing of the bands suggests decreasing volatility and a potential period of consolidation.
- Bollinger Band %B (BBP): The %B values are close to 1, indicating a potential squeeze in price movement.
Volume Indicators Analysis:
- OBV: The OBV has shown a slight increase, indicating some accumulation.
- CMF: The negative CMF suggests distribution despite the increase in volume.
Key Observations:
- The stock is currently in an uptrend supported by moving averages and MACD.
- Momentum indicators signal overbought conditions, hinting at a possible correction.
- Volatility indicators point towards a period of consolidation.
- Volume indicators show mixed signals with slight accumulation but negative CMF.
Conclusion:
Based on the analysis of technical indicators, the next few days for PSEP stock price movement could see a potential consolidation or sideways movement. The overbought signals from momentum indicators suggest a possible pullback, while the narrowing Bollinger Bands indicate a reduced volatility environment. The mixed volume signals imply a cautious outlook despite some accumulation. Traders may consider taking profits or waiting for a clearer trend before entering new positions.