Technical Analysis of PMAR 2024-05-10
Overview:
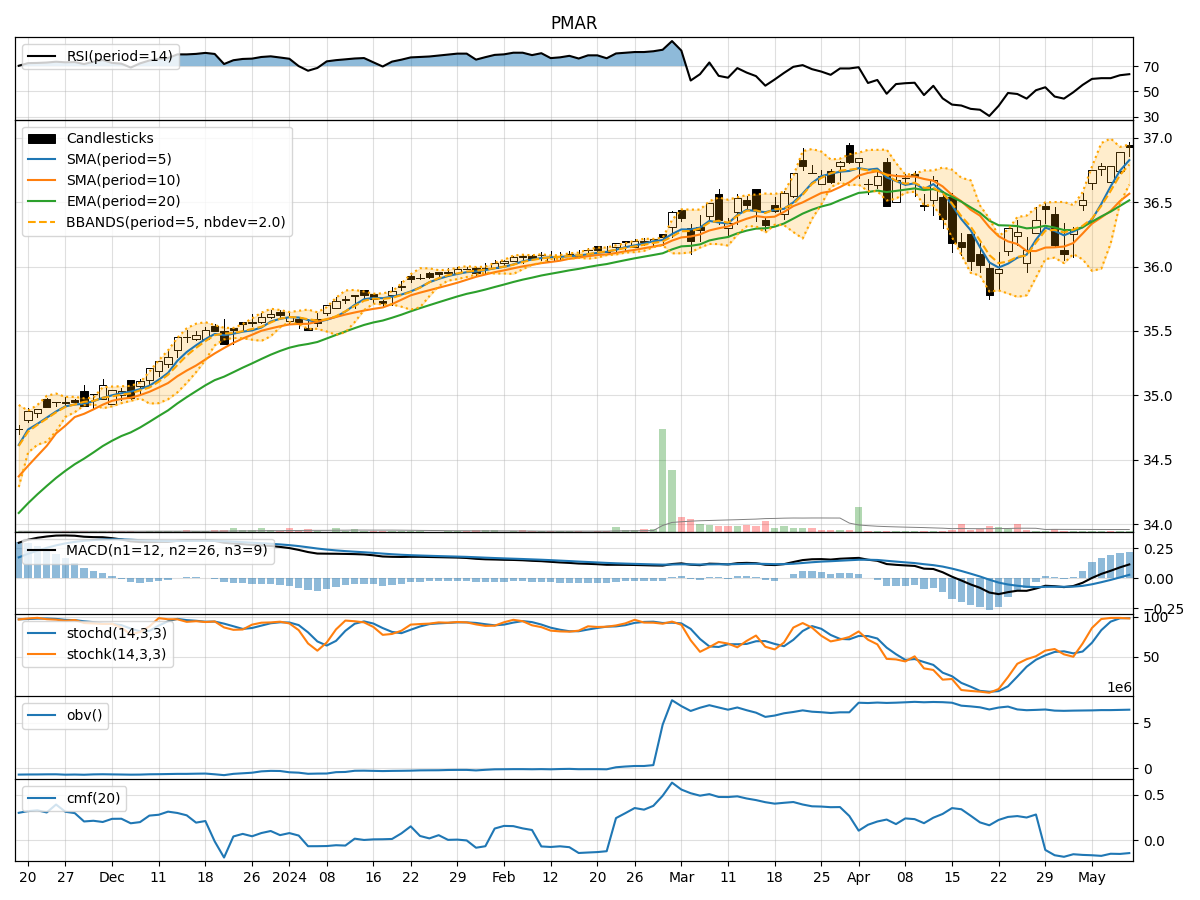
In analyzing the technical indicators for PMAR stock over the last 5 days, we will delve into the trends, momentum, volatility, and volume aspects to provide a comprehensive outlook on the possible stock price movement in the coming days. By examining key indicators such as moving averages, MACD, RSI, Bollinger Bands, and OBV, we aim to offer valuable insights and predictions for potential price action.
Trend Analysis:
- Moving Averages (MA): The 5-day moving average has been consistently rising, indicating a bullish trend in the short term.
- MACD: The MACD line has been above the signal line, suggesting positive momentum in the stock price.
Momentum Analysis:
- RSI: The RSI has been increasing, showing strengthening momentum in the stock.
- Stochastic Oscillator: Both %K and %D have been in the overbought zone, signaling a potential reversal or consolidation.
Volatility Analysis:
- Bollinger Bands: The stock price has been trading within the bands, indicating a period of consolidation.
Volume Analysis:
- On-Balance Volume (OBV): The OBV has been relatively stable, suggesting a neutral volume trend.
Key Observations:
- The stock is currently in an upward trend based on moving averages and MACD.
- Momentum indicators like RSI show positive momentum in the stock.
- Volatility is low as indicated by Bollinger Bands, suggesting a period of consolidation.
- Volume has not shown significant changes, indicating stability in trading activity.
Conclusion:
Based on the analysis of technical indicators, the next few days for PMAR stock are likely to see continued upward movement with positive momentum. However, the stock may experience a period of consolidation due to low volatility. Traders should monitor the stochastic oscillator for potential signs of a reversal or pullback. Overall, the outlook for PMAR stock remains bullish in the short term.