Technical Analysis of PCY 2024-05-10
Overview:
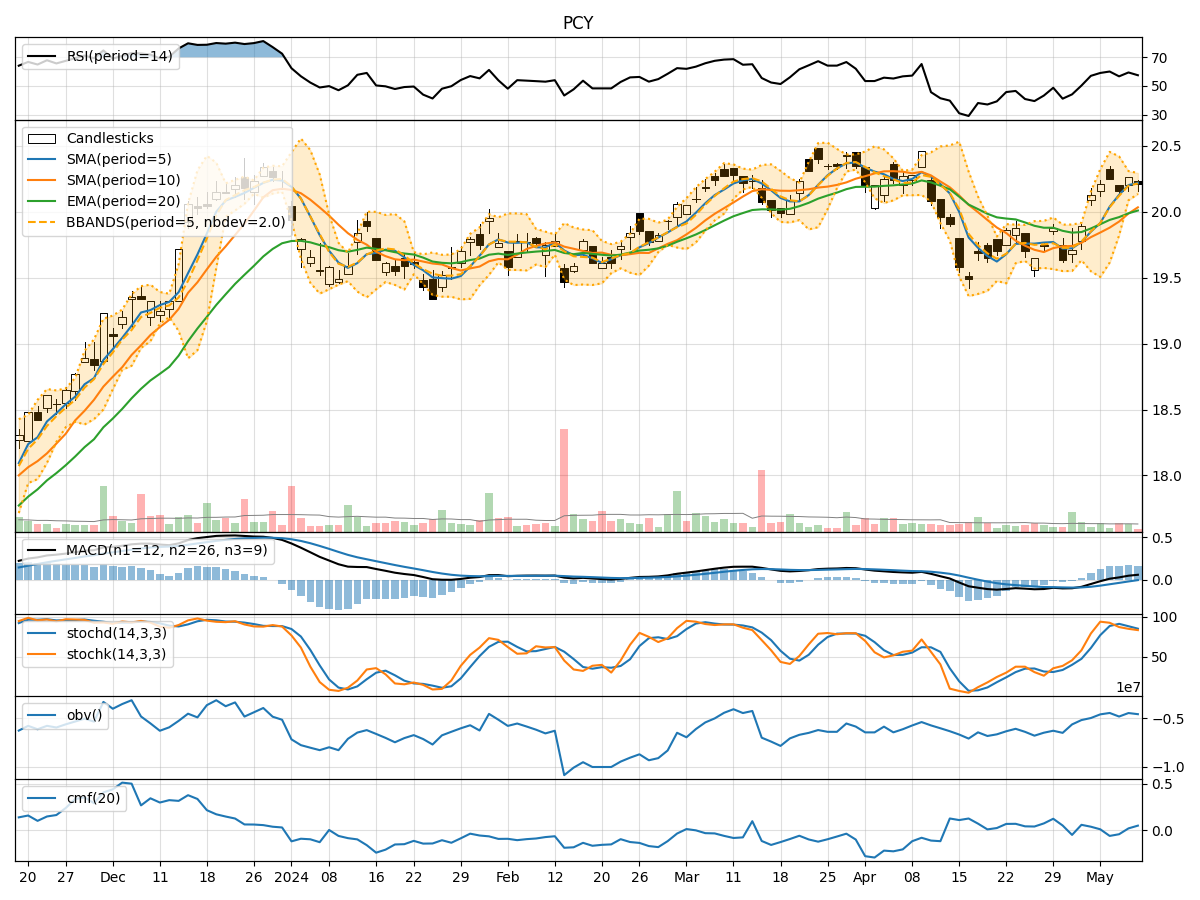
In analyzing the technical indicators for PCY over the last 5 days, we will delve into the trend, momentum, volatility, and volume indicators to provide a comprehensive outlook on the possible stock price movement in the coming days. By examining key metrics such as moving averages, MACD, RSI, Bollinger Bands, and OBV, we aim to offer valuable insights and recommendations for potential trading strategies.
Trend Analysis:
- Moving Averages (MA): The 5-day moving average has been consistently above the 10-day simple moving average, indicating a short-term bullish trend.
- MACD: The MACD line has been consistently above the signal line, with both lines trending upwards, suggesting bullish momentum.
- EMA: The exponential moving average has been steadily increasing, supporting the bullish trend.
Momentum Analysis:
- RSI: The Relative Strength Index has been fluctuating around the 50 level, indicating a neutral momentum in the stock.
- Stochastic Oscillator: Both %K and %D have been hovering around the oversold territory, suggesting a potential reversal in momentum.
- Williams %R: The Williams %R is in the oversold region, indicating a possible buying opportunity.
Volatility Analysis:
- Bollinger Bands: The stock price has been trading within the Bollinger Bands, with the bands narrowing, indicating decreasing volatility.
- Bollinger %B: The %B indicator is below 1, suggesting the stock is trading below the upper Bollinger Band.
Volume Analysis:
- On-Balance Volume (OBV): The OBV has been fluctuating, indicating mixed buying and selling pressure.
- Chaikin Money Flow (CMF): The CMF has been positive, indicating buying pressure in the stock.
Key Observations:
- The trend indicators suggest a bullish sentiment in the short term.
- Momentum indicators show a neutral stance with potential for a reversal.
- Volatility indicators point towards decreasing volatility in the stock.
- Volume indicators indicate mixed buying and selling pressure.
Conclusion:
Based on the analysis of the technical indicators, the stock is likely to experience sideways consolidation in the coming days. While the trend indicators signal a bullish outlook, the neutral momentum and mixed volume suggest a lack of strong conviction in either direction. Additionally, decreasing volatility indicates a period of consolidation. Traders may consider waiting for clearer signals or implementing range-bound strategies until a more definitive trend emerges.