Technical Analysis of PBTP 2024-05-10
Overview:
In analyzing the provided Technical Analysis (TA) data for PBTP stock over the last 5 days, we will delve into the trend, momentum, volatility, and volume indicators to forecast the possible stock price movement in the upcoming days. By examining these key indicators, we aim to provide a comprehensive and insightful prediction for the future direction of PBTP stock.
Trend Analysis:
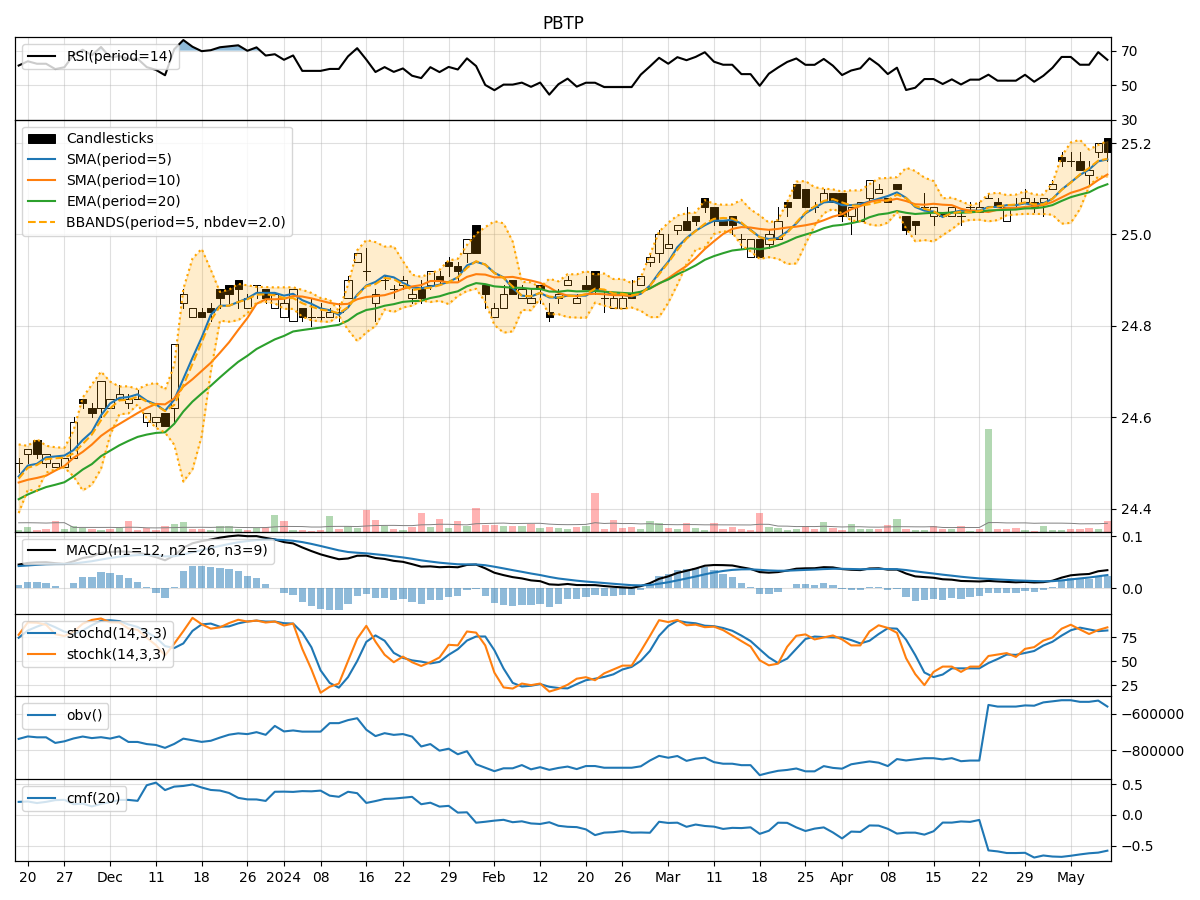
- Moving Averages (MA): The 5-day Moving Average (MA) has been consistently above the Simple Moving Average (SMA) and Exponential Moving Average (EMA), indicating a bullish trend.
- MACD: The MACD line has been consistently above the signal line, with both lines showing an upward trend, suggesting bullish momentum.
- RSI: The Relative Strength Index (RSI) has been fluctuating around the overbought territory, indicating strong buying pressure.
Momentum Analysis:
- Stochastic Oscillator: Both %K and %D lines of the Stochastic Oscillator have been in the overbought zone, suggesting a potential reversal or consolidation.
- Williams %R: The Williams %R indicator has been fluctuating between oversold and overbought levels, indicating mixed momentum.
Volatility Analysis:
- Bollinger Bands (BB): The stock price has been trading within the Bollinger Bands, with the bands narrowing, indicating decreasing volatility.
- BB %B: The %B indicator has been fluctuating within a narrow range, suggesting a period of consolidation.
Volume Analysis:
- On-Balance Volume (OBV): The OBV indicator has been relatively flat, indicating a balance between buying and selling pressure.
- Chaikin Money Flow (CMF): The CMF has been negative, suggesting outflow of money from the stock.
Key Observations:
- The trend indicators suggest a bullish bias in the short term.
- Momentum indicators show signs of potential reversal or consolidation.
- Volatility indicators point towards decreasing volatility and a period of consolidation.
- Volume indicators indicate a balance between buying and selling pressure with a slight outflow of money.
Conclusion:
Based on the analysis of the technical indicators, the next few days for PBTP stock are likely to see sideways movement or consolidation. While the trend indicators remain bullish, the momentum indicators suggest a potential reversal or consolidation phase. The decreasing volatility and balanced volume further support the view of a sideways movement. Traders may consider staying cautious and monitoring key support and resistance levels for potential trading opportunities.