Technical Analysis of PBFB 2024-05-10
Overview:
In analyzing the technical indicators for PBFB over the last 5 days, we will delve into the trend, momentum, volatility, and volume indicators to provide a comprehensive outlook on the possible stock price movement. By examining these key aspects, we aim to offer valuable insights and recommendations for potential future price action.
Trend Indicators:
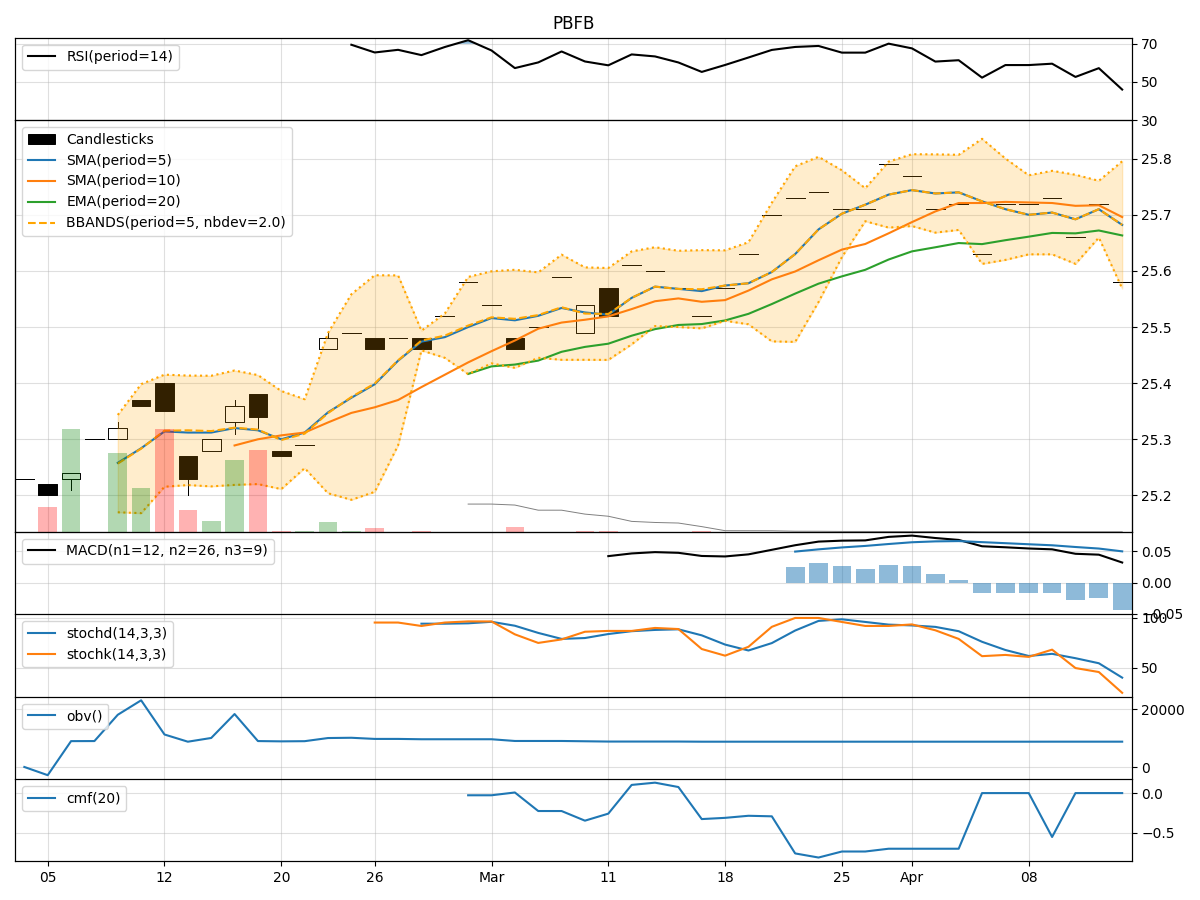
- Moving Averages (MA): The 5-day MA has been consistently above the closing prices, indicating a bullish trend.
- MACD: The MACD line has been steadily increasing, with the MACD histogram showing positive values, suggesting upward momentum.
- EMA: The EMA has been trending upwards, supporting the bullish sentiment.
Momentum Indicators:
- RSI: The RSI has been in the 60-70 range, indicating a moderate level of buying pressure.
- Stochastic Oscillator: Both %K and %D have been at 100%, signaling overbought conditions.
- Williams %R: The indicator has consistently been at 0, reflecting a strong bullish momentum.
Volatility Indicators:
- Bollinger Bands (BB): The bands have been narrowing, suggesting decreasing volatility.
- BB %B: The %B indicator has been hovering around 0.8-0.9, indicating a strong uptrend with potential overbought conditions.
Volume Indicators:
- On-Balance Volume (OBV): The OBV has remained constant, indicating a lack of significant volume changes.
- Chaikin Money Flow (CMF): The CMF has been negative, suggesting a bearish money flow trend.
Key Observations and Opinions:
- Trend: The trend indicators point towards a strong bullish sentiment, supported by moving averages and MACD.
- Momentum: Momentum indicators suggest overbought conditions, potentially leading to a short-term pullback.
- Volatility: Decreasing volatility may indicate a period of consolidation or a potential reversal.
- Volume: The lack of significant volume changes coupled with negative CMF raises concerns about the sustainability of the current uptrend.
Conclusion:
Based on the analysis of the technical indicators, the next few days for PBFB stock price movement could see a short-term pullback or consolidation. The overbought conditions indicated by momentum indicators and narrowing Bollinger Bands suggest a possible correction in the near future. Traders should exercise caution and consider taking profits or implementing risk management strategies.