Technical Analysis of PAAA 2024-05-10
Overview:
In analyzing the technical indicators for PAAA stock over the last 5 days, we will delve into the trend, momentum, volatility, and volume indicators to provide a comprehensive outlook on the possible stock price movement in the coming days.
Trend Analysis:
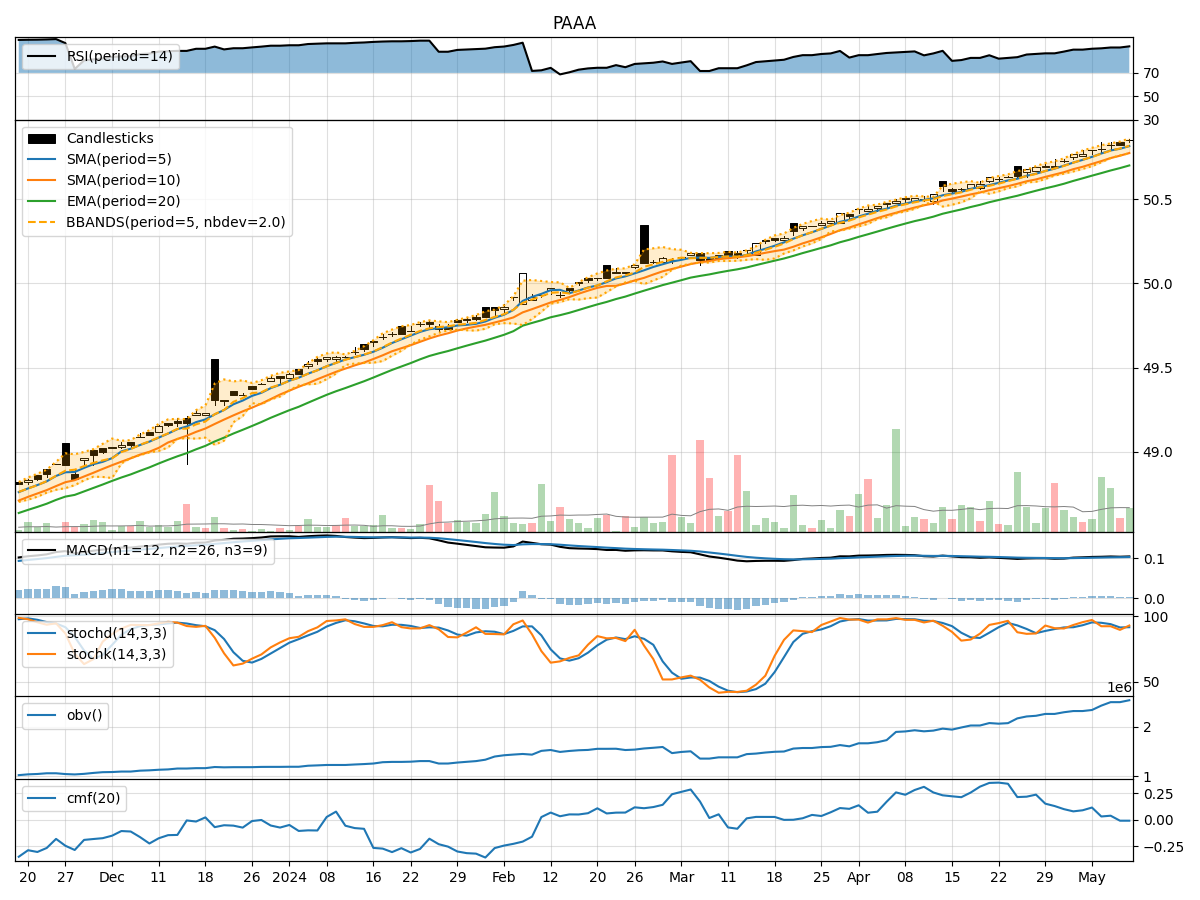
- Moving Averages (MA): The 5-day Moving Average (MA) has been consistently above the Simple Moving Average (SMA) and Exponential Moving Average (EMA), indicating a bullish trend.
- MACD: The MACD line has been consistently above the signal line, with both lines showing an upward trend, suggesting bullish momentum.
Momentum Analysis:
- RSI: The Relative Strength Index (RSI) has been consistently above 70, indicating overbought conditions but also strong bullish momentum.
- Stochastic Oscillator: Both %K and %D have been in the overbought zone, suggesting a strong bullish momentum.
Volatility Analysis:
- Bollinger Bands (BB): The stock price has been consistently trading above the middle Bollinger Band (BBM), indicating an upward trend with low volatility.
Volume Analysis:
- On-Balance Volume (OBV): The OBV has been steadily increasing, indicating strong buying pressure.
- Chaikin Money Flow (CMF): The CMF has been positive, suggesting that money is flowing into the stock.
Key Observations:
- The stock is in a strong bullish trend based on moving averages and MACD.
- Momentum indicators like RSI and Stochastic Oscillator signal overbought conditions but strong bullish momentum.
- Volatility is low, as indicated by the Bollinger Bands, suggesting a stable uptrend.
- Volume indicators show increasing buying pressure and positive money flow into the stock.
Conclusion:
Based on the analysis of technical indicators, the next few days are likely to see the stock price continue its upward movement. The strong bullish trend, supported by momentum, low volatility, and increasing buying pressure, indicates a favorable outlook for PAAA stock. Traders and investors may consider maintaining or initiating long positions in anticipation of further price appreciation.
Disclaimer:
Remember that while technical analysis provides valuable insights, it is not a guaranteed predictor of future price movements. It is essential to consider other factors and risk management strategies in your trading decisions.