Technical Analysis of OVLH 2024-05-10
Overview:
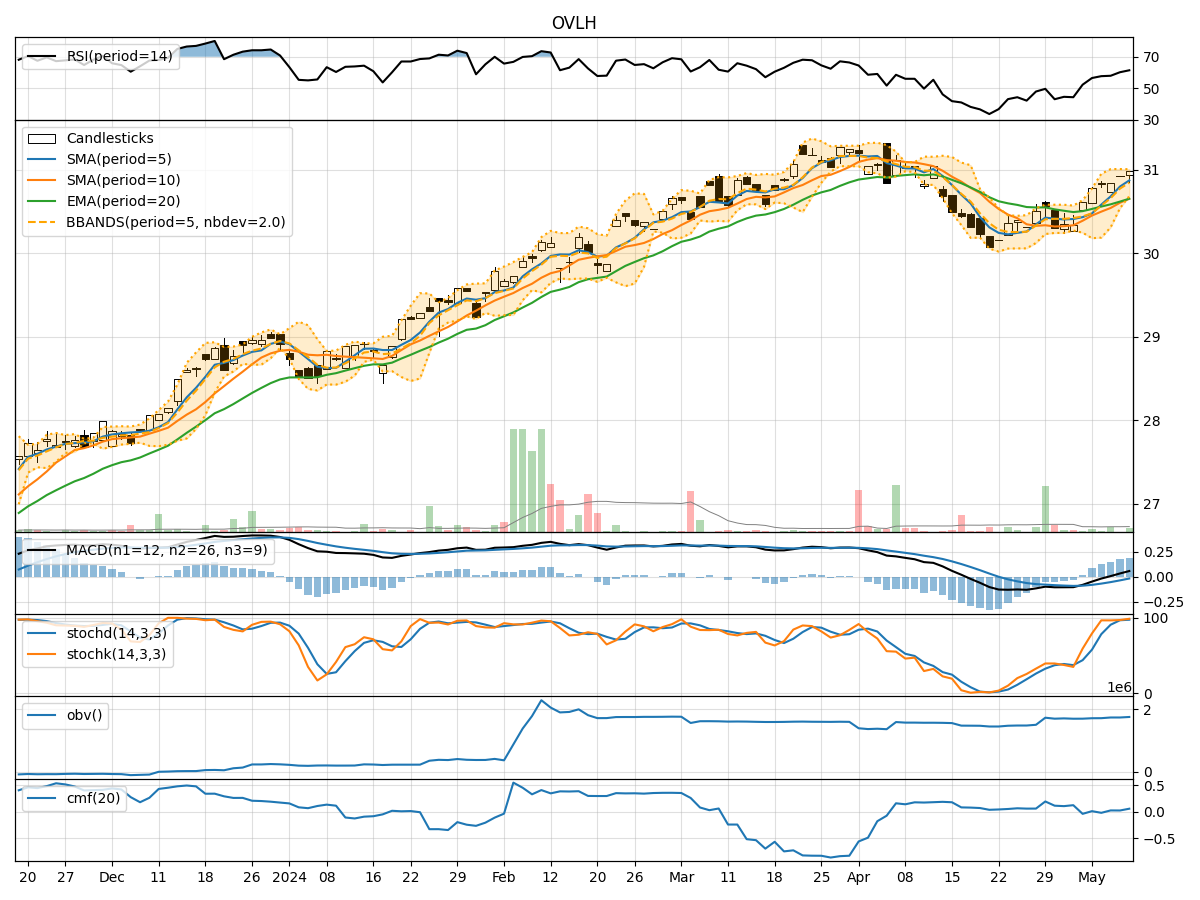
In analyzing the technical indicators for OVLH over the last 5 days, we will delve into the trend, momentum, volatility, and volume indicators to provide a comprehensive outlook on the possible stock price movement in the coming days. By examining these key indicators, we aim to offer valuable insights and predictions for potential investors.
Trend Analysis:
- Moving Averages (MA): The 5-day Moving Average (MA) has been consistently above the Simple Moving Average (SMA) and Exponential Moving Average (EMA), indicating a bullish trend.
- MACD: The MACD line has been consistently above the signal line, suggesting a bullish momentum in the stock price.
- MACD Histogram: The MACD Histogram has been increasing over the last 5 days, indicating strengthening bullish momentum.
Momentum Analysis:
- RSI: The Relative Strength Index (RSI) has been gradually increasing and is currently in the overbought territory, signaling a strong bullish momentum.
- Stochastic Oscillator: Both %K and %D lines of the Stochastic Oscillator are in the overbought zone, indicating a potential reversal or consolidation.
- Williams %R: The Williams %R is also in the oversold region, suggesting a possible reversal in the stock price.
Volatility Analysis:
- Bollinger Bands (BB): The stock price has been trading within the upper Bollinger Band (BBU) range, indicating high volatility.
- Bollinger Band Width: The Bollinger Band Width has been narrowing, suggesting a potential decrease in volatility.
- Bollinger Band %B: The %B indicator is above 0.8, indicating a relatively high price level compared to the recent past.
Volume Analysis:
- On-Balance Volume (OBV): The OBV indicator has been steadily increasing over the last 5 days, reflecting strong buying pressure.
- Chaikin Money Flow (CMF): The CMF indicator is positive, indicating that money is flowing into the stock.
Conclusion:
Based on the analysis of the technical indicators, the stock of OVLH is currently exhibiting strong bullish momentum with the potential for a continuation of the upward trend in the coming days. However, caution is advised as some indicators such as the Stochastic Oscillator and Williams %R suggest the stock may be overbought and could experience a short-term pullback or consolidation. Traders should closely monitor these indicators for any signs of a reversal in the stock price movement.
In summary, the overall outlook for OVLH is bullish in the short term, but investors should remain vigilant and consider risk management strategies to navigate potential market fluctuations.