Technical Analysis of OVF 2024-05-10
Overview:
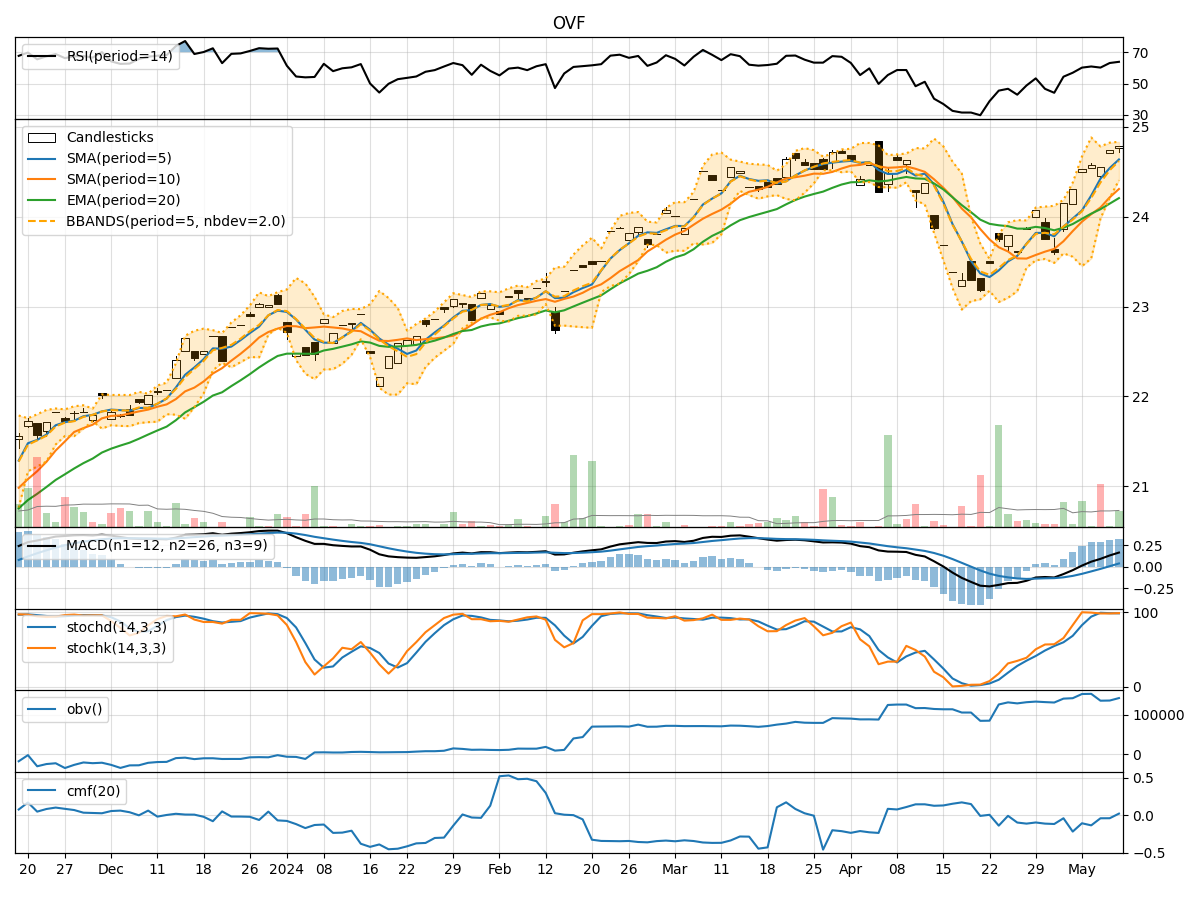
In analyzing the provided Technical Analysis (TA) data for the last 5 days of OVF stock, we will delve into the trend, momentum, volatility, and volume indicators to forecast the possible stock price movement in the upcoming days. By examining key metrics such as moving averages, MACD, RSI, Bollinger Bands, and OBV, we aim to provide a comprehensive and insightful prediction for OVF stock.
Trend Indicators:
- Moving Averages (MA): The 5-day MA has been consistently above the 10-day SMA, indicating a short-term bullish trend.
- MACD: The MACD line has been above the signal line for the past 5 days, suggesting bullish momentum.
- EMA: The EMA has been steadily increasing, reflecting a positive trend in the stock price.
Momentum Indicators:
- RSI: The RSI has been hovering around 60-64, indicating a neutral to slightly bullish momentum.
- Stochastic Oscillator: Both %K and %D have been relatively high, suggesting a bullish sentiment.
- Williams %R: The Williams %R is close to 0, indicating a potential overbought condition.
Volatility Indicators:
- Bollinger Bands: The stock price has been trading within the upper Bollinger Band, indicating an uptrend with increased volatility.
- Bollinger Band Width: The Band Width has been narrowing, suggesting a potential decrease in volatility.
- Bollinger Band %B: The %B is above 0.5, indicating an upward momentum.
Volume Indicators:
- On-Balance Volume (OBV): The OBV has been fluctuating but has not shown a clear trend, indicating mixed sentiment among investors.
- Chaikin Money Flow (CMF): The CMF has been negative, suggesting selling pressure in the stock.
Key Observations and Opinions:
- Trend: The stock is currently in an upward trend based on moving averages and MACD.
- Momentum: Momentum indicators suggest a bullish sentiment in the short term.
- Volatility: Bollinger Bands indicate an uptrend with increased volatility.
- Volume: The OBV and CMF show mixed sentiment among investors.
Conclusion:
Based on the analysis of the technical indicators, the next few days for OVF stock are likely to see a continuation of the upward trend with increased volatility. Investors should consider the bullish momentum and the potential for a short-term price increase. However, it is essential to monitor the volume indicators closely for any shifts in sentiment. Overall, the outlook for OVF stock appears bullish in the near term.