Technical Analysis of OUSA 2024-05-10
Overview:
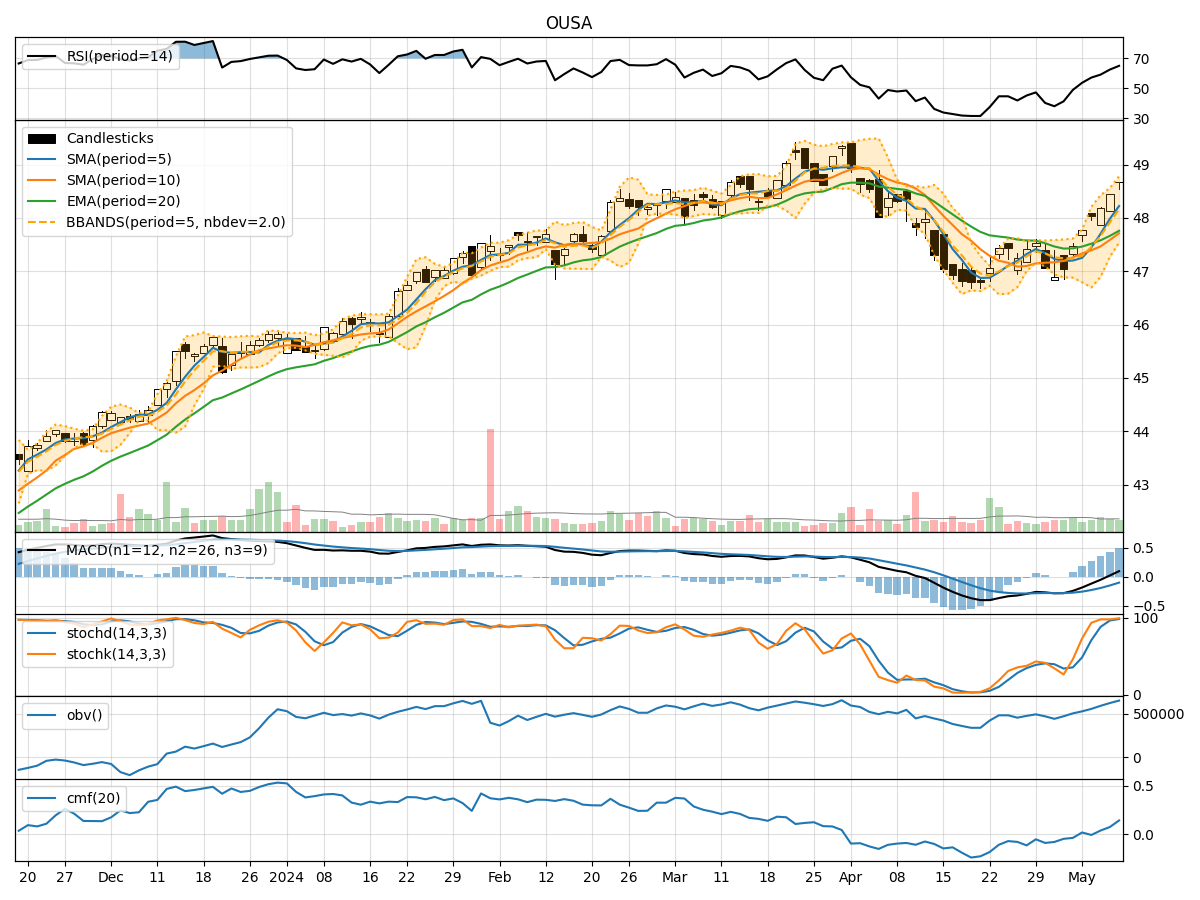
In analyzing the technical indicators for OUSA stock over the last 5 days, we will delve into the trend, momentum, volatility, and volume indicators to provide a comprehensive outlook on the possible stock price movement in the coming days. By examining these key indicators, we aim to offer valuable insights and predictions for informed decision-making.
Trend Analysis:
- Moving Averages (MA): The 5-day MA has been consistently rising, indicating a bullish trend in the short term.
- MACD: The MACD line has been above the signal line, suggesting a bullish momentum.
- EMA: The EMA has been trending upwards, supporting the bullish sentiment in the market.
Momentum Analysis:
- RSI: The RSI has been increasing, showing strengthening buying momentum.
- Stochastic Oscillator: Both %K and %D have been in the overbought zone, indicating a strong bullish momentum.
- Williams %R: The indicator has been hovering near the oversold territory, suggesting a potential reversal.
Volatility Analysis:
- Bollinger Bands: The stock price has been trading above the middle band, indicating an uptrend with moderate volatility.
- Bollinger %B: The %B indicator has been above 0.5, signaling bullish momentum.
- Bollinger Band Width: The band width has been narrowing, suggesting a potential decrease in volatility.
Volume Analysis:
- On-Balance Volume (OBV): The OBV has been steadily increasing, reflecting strong buying pressure.
- Chaikin Money Flow (CMF): The CMF has been positive, indicating money flow into the stock.
Conclusion:
Based on the analysis of the technical indicators, the overall outlook for OUSA stock in the next few days is bullish. The trend indicators, momentum oscillators, volatility measures, and volume indicators all point towards a continuation of the current uptrend. Traders and investors may consider buying opportunities in anticipation of further price appreciation. It is essential to monitor the indicators closely for any signs of reversal or trend exhaustion.
In summary, the technical analysis suggests that OUSA stock is likely to experience upward movement in the coming days. This assessment is supported by the convergence of multiple bullish signals across various indicators. However, it is crucial to remain vigilant and adapt to changing market conditions to make well-informed trading decisions.