Technical Analysis of OCTT 2024-05-10
Overview:
In analyzing the technical indicators for OCTT over the last 5 days, we will delve into the trend, momentum, volatility, and volume indicators to provide a comprehensive outlook on the possible stock price movement in the coming days. By examining these key aspects, we aim to offer valuable insights and recommendations for potential investors.
Trend Analysis:
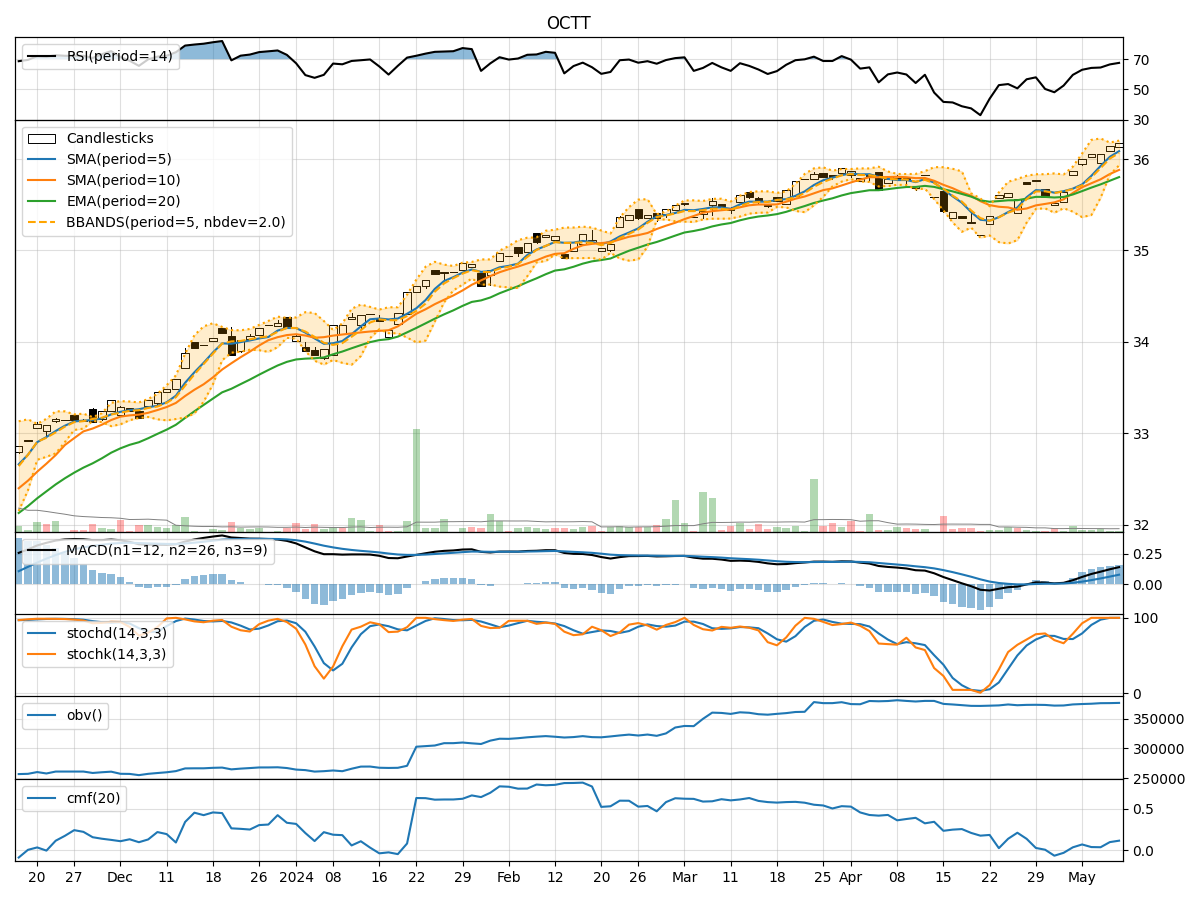
- Moving Averages (MA): The moving averages have been showing a consistent uptrend, with the 5-day MA consistently above the 10-day SMA and 20-day EMA. This indicates a positive trend in the stock price.
- MACD: The MACD line has been steadily increasing, indicating bullish momentum in the stock.
- MACD Histogram: The MACD histogram has been rising, suggesting increasing bullish momentum.
Momentum Analysis:
- RSI: The RSI has been trending upwards, indicating increasing buying pressure in the stock.
- Stochastic Oscillator: Both %K and %D in the stochastic oscillator have been at 100%, signaling strong bullish momentum.
- Williams %R: The Williams %R has been consistently at 0, indicating the stock is in oversold territory.
Volatility Analysis:
- Bollinger Bands: The Bollinger Bands have been narrowing, suggesting decreasing volatility in the stock price.
- Bollinger %B: The %B indicator has been hovering around 0.8-0.9, indicating the stock is trading near the upper band.
Volume Analysis:
- On-Balance Volume (OBV): The OBV has been steadily increasing, indicating strong buying volume in the stock.
- Chaikin Money Flow (CMF): The CMF has been positive, suggesting that money is flowing into the stock.
Key Observations:
- The stock is currently in a strong uptrend based on moving averages and MACD indicators.
- Momentum indicators like RSI and Stochastic Oscillator suggest strong bullish momentum.
- Volatility has been decreasing, indicating a potential consolidation phase.
- Increasing OBV and positive CMF point towards strong buying interest in the stock.
Conclusion:
Based on the analysis of the technical indicators, the next few days' possible stock price movement for OCTT is likely to continue upwards. The stock shows strong bullish momentum, supported by positive trends in moving averages and momentum indicators. While a short consolidation phase cannot be ruled out due to decreasing volatility, the overall outlook remains bullish. Investors may consider buying or holding positions in OCTT for potential further upside.