Technical Analysis of OCTD 2024-05-10
Overview:
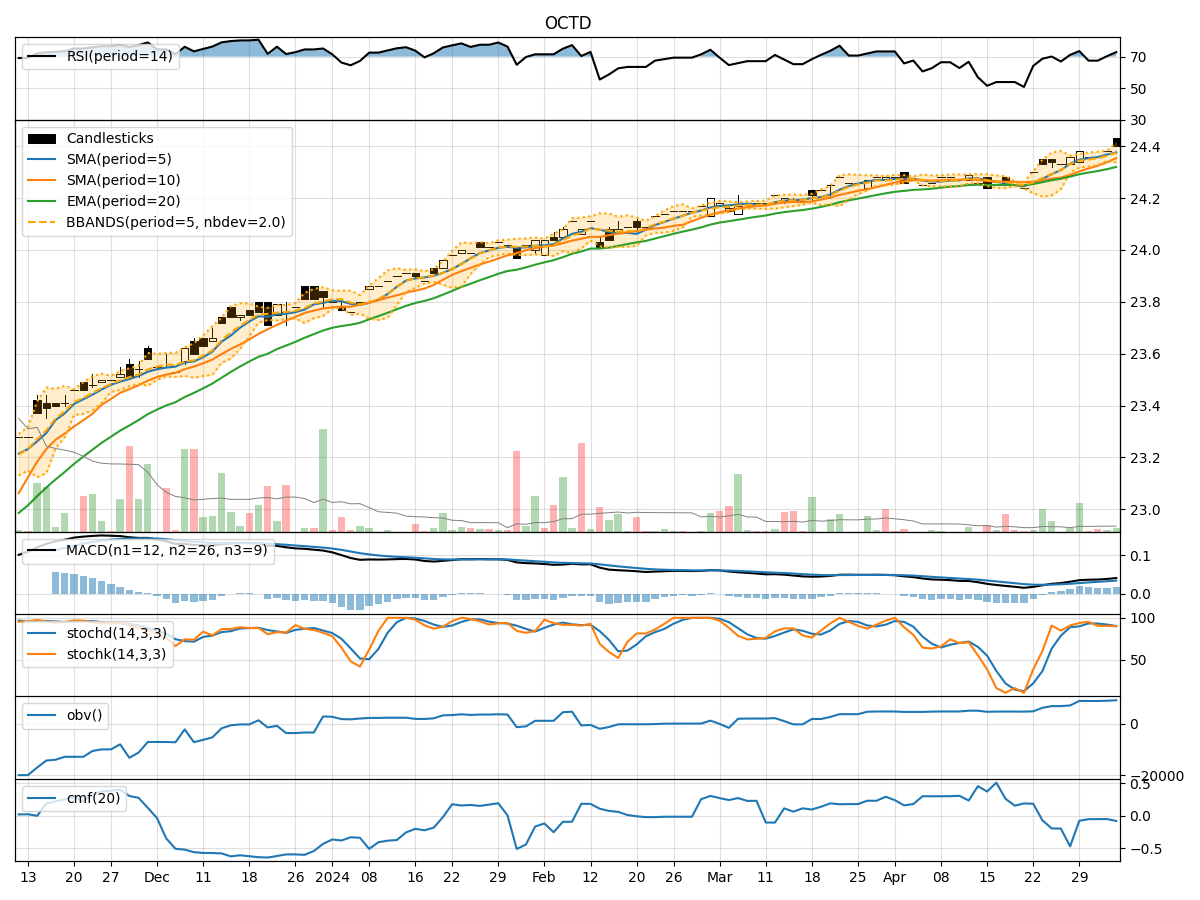
In analyzing the technical indicators for OCTD over the last 5 days, we will delve into the trend, momentum, volatility, and volume indicators to provide a comprehensive outlook on the possible stock price movement in the coming days. By examining these key indicators, we aim to offer valuable insights and predictions for potential investors.
Trend Indicators:
- Moving Averages (MA): The 5-day MA has been steadily increasing, indicating a positive trend in the stock price.
- MACD: The MACD line has been consistently above the signal line, suggesting bullish momentum.
- EMA: The Exponential Moving Average has been on an upward trajectory, supporting the bullish sentiment.
Key Observation: The trend indicators point towards an upward trend in the stock price.
Momentum Indicators:
- RSI: The Relative Strength Index has been in the overbought territory, indicating strong buying momentum.
- Stochastic Oscillator: Both %K and %D have been relatively high, signaling bullish momentum.
- Williams %R: The indicator has been hovering in the oversold region, suggesting potential buying opportunities.
Key Observation: Momentum indicators reflect a bullish sentiment in the stock.
Volatility Indicators:
- Bollinger Bands: The bands have been widening, indicating increased volatility in the stock price.
- Bollinger %B: The %B has been fluctuating within a range, suggesting potential price reversals.
- Average True Range (ATR): The ATR value has been relatively stable, indicating consistent volatility levels.
Key Observation: Volatility indicators suggest increased volatility in the stock price.
Volume Indicators:
- On-Balance Volume (OBV): The OBV has been increasing, indicating higher buying volume.
- Chaikin Money Flow (CMF): The CMF has been negative, suggesting outflow of money from the stock.
Key Observation: Volume indicators show mixed signals with increasing OBV but negative CMF.
Conclusion:
Based on the analysis of the technical indicators, the stock of OCTD is likely to experience further upward movement in the coming days. The trend indicators, momentum indicators, and overall market sentiment all point towards a bullish outlook. However, the increased volatility and mixed volume signals suggest that there may be some short-term fluctuations in the stock price.
Key Conclusion: The stock of OCTD is expected to continue its upward trajectory in the near term, with potential short-term fluctuations due to increased volatility. Investors should consider capitalizing on buying opportunities during any dips in the stock price.