Technical Analysis of OBND 2024-05-10
Overview:
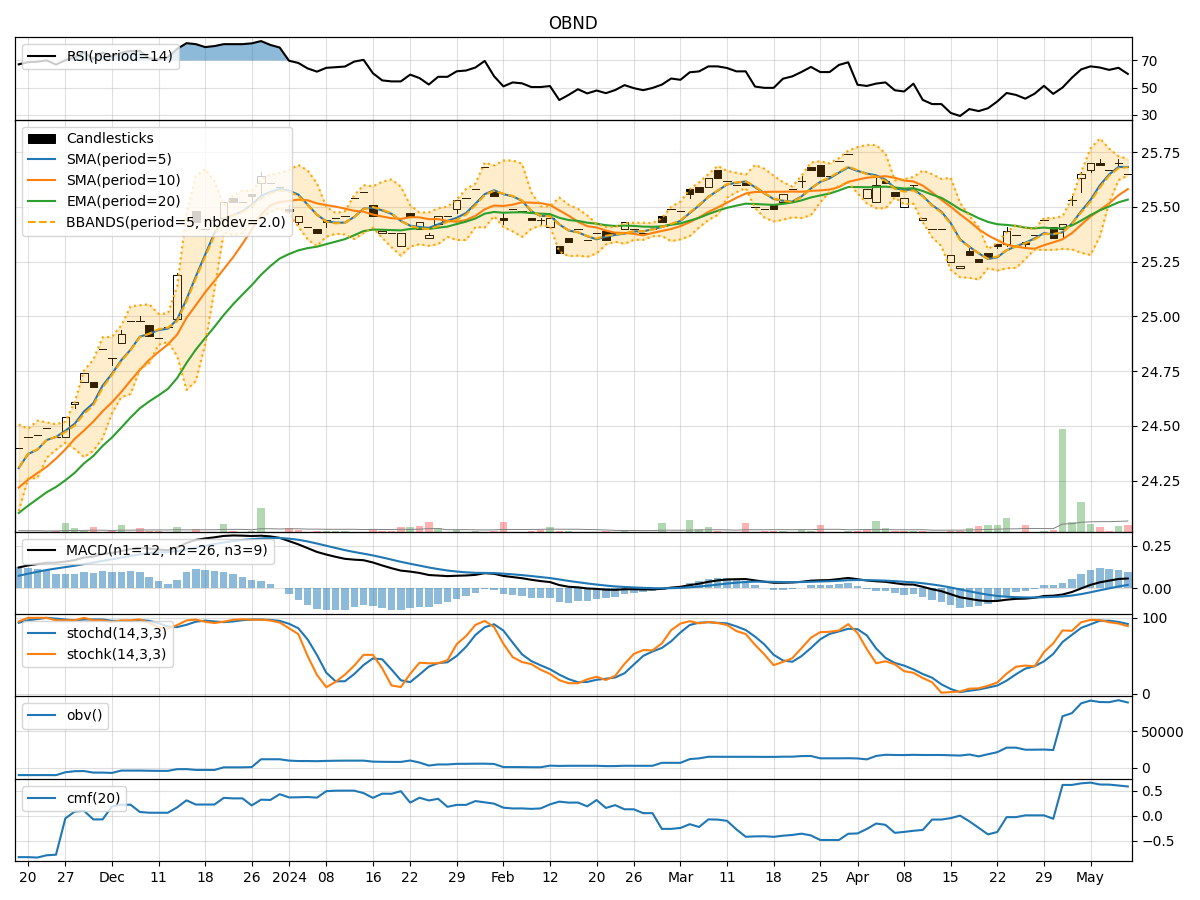
In analyzing the technical indicators for OBND over the last 5 days, we will delve into the trend, momentum, volatility, and volume indicators to provide a comprehensive outlook on the possible stock price movement in the coming days. By examining these key indicators, we aim to offer valuable insights and predictions for informed decision-making.
Trend Analysis:
- Moving Averages (MA): The 5-day Moving Average (MA) has been steadily increasing, indicating a positive trend in the stock price.
- MACD: The Moving Average Convergence Divergence (MACD) shows a consistent uptrend with the MACD line above the signal line, suggesting bullish momentum.
- RSI: The Relative Strength Index (RSI) is in the overbought territory, indicating a potential reversal or consolidation.
Momentum Analysis:
- Stochastic Oscillator: Both %K and %D levels are high, signaling an overbought condition and a possible upcoming correction.
- Williams %R: The Williams %R is in the oversold region, suggesting a potential reversal to the upside.
Volatility Analysis:
- Bollinger Bands: The Bollinger Bands are narrowing, indicating decreasing volatility and a potential breakout or significant price movement ahead.
Volume Analysis:
- On-Balance Volume (OBV): The OBV has been fluctuating, indicating mixed buying and selling pressure.
- Chaikin Money Flow (CMF): The CMF is positive but decreasing, suggesting a weakening buying pressure.
Key Observations:
- The stock is currently in a bullish trend based on moving averages and MACD.
- Momentum indicators suggest a potential correction due to overbought conditions.
- Volatility is decreasing, indicating a potential consolidation before a significant move.
- Volume indicators show mixed signals with fluctuating OBV and decreasing CMF.
Conclusion:
Based on the analysis of technical indicators, the next few days' possible stock price movement for OBND is likely to experience a short-term correction or consolidation before potentially resuming its bullish trend. Traders should be cautious of the overbought conditions indicated by momentum indicators and monitor for a potential breakout indicated by narrowing Bollinger Bands. Overall, the outlook remains bullish but with a short-term cautionary stance.