Technical Analysis of NVBW 2024-05-10
Overview:
In analyzing the technical indicators for NVBW over the last 5 days, we will delve into the trend, momentum, volatility, and volume indicators to provide a comprehensive outlook on the possible stock price movement in the coming days. By examining these key aspects, we aim to offer valuable insights and predictions to guide your investment decisions.
Trend Indicators:
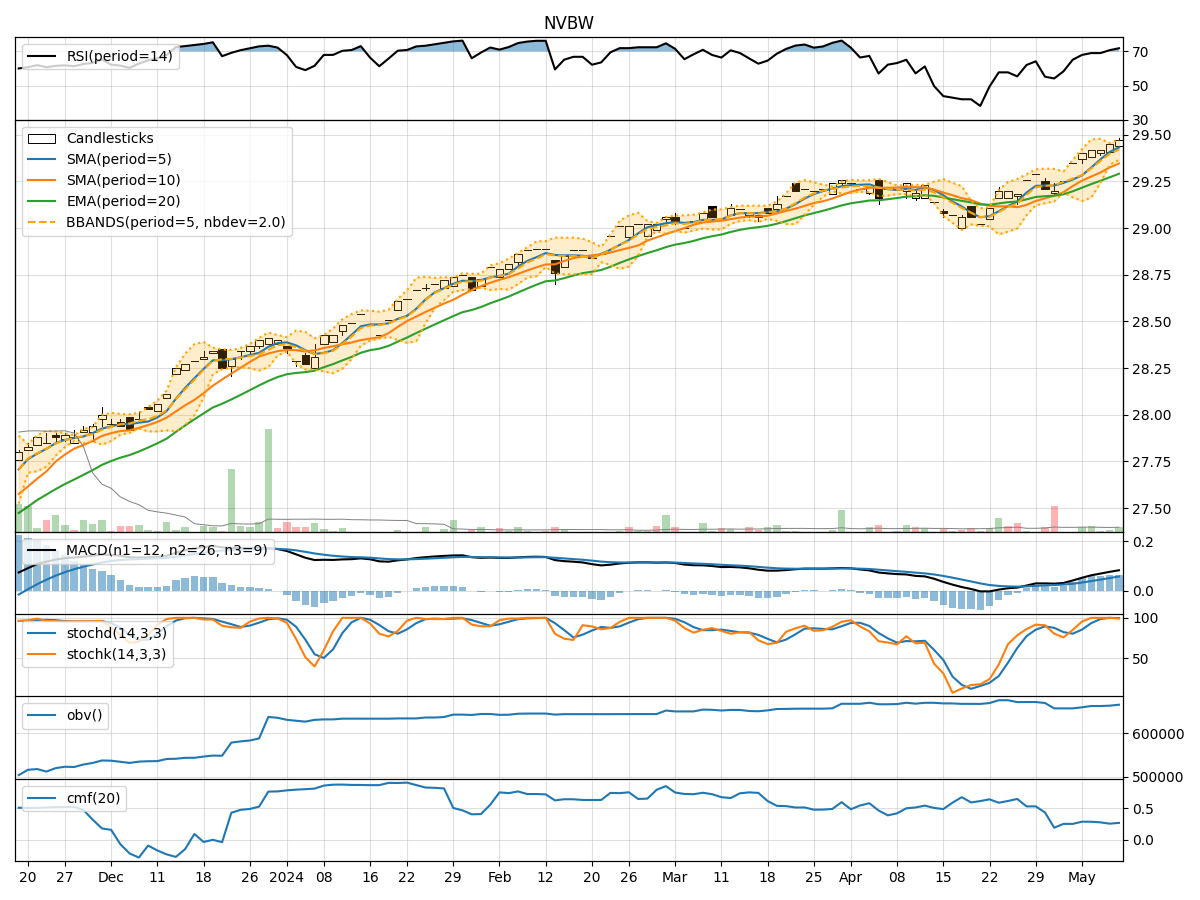
- Moving Averages (MA): The 5-day MA has been consistently above the 10-day SMA, indicating a short-term bullish trend. The EMA(20) has shown a gradual uptrend, suggesting positive momentum.
- MACD: The MACD line has been above the signal line, with both lines showing an upward trajectory. The MACD histogram has been increasing, indicating strengthening bullish momentum.
Momentum Indicators:
- RSI: The RSI has been in the overbought territory, suggesting a strong bullish momentum. However, it is important to note that extreme RSI levels could potentially lead to a reversal.
- Stochastic Oscillator: Both %K and %D have been in the overbought zone, indicating a strong buying pressure. The recent slight divergence between %K and %D could signal a potential reversal.
Volatility Indicators:
- Bollinger Bands (BB): The stock price has been trading within the upper Bollinger Band, indicating an overbought condition. The narrowing of the bands suggests a decrease in volatility.
- Bollinger %B: The %B indicator has been above 0.8, indicating a high price relative to the upper band and a potential overbought situation.
Volume Indicators:
- On-Balance Volume (OBV): The OBV has shown a gradual increase over the last 5 days, indicating accumulation by investors. This aligns with the rising stock price.
- Chaikin Money Flow (CMF): The CMF(20) has been positive, indicating buying pressure. However, the slight decline in CMF could signal a potential decrease in buying interest.
Conclusion:
Based on the analysis of the technical indicators, the stock of NVBW is currently in an overbought condition with strong bullish momentum. The trend is upward, supported by the moving averages and MACD. However, the overbought signals from RSI and Stochastic Oscillator, along with the high Bollinger %B, suggest a potential reversal or consolidation in the near term.
Considering the overall picture, it is advisable to exercise caution and closely monitor the price action in the coming days. A short-term correction or consolidation could be on the horizon before a potential continuation of the uptrend. Traders may consider taking profits or implementing risk management strategies in anticipation of a possible pullback.
Remember, technical analysis is a valuable tool, but it is essential to combine it with fundamental analysis and market dynamics for a well-rounded investment approach. Stay vigilant and adapt to changing market conditions to make informed decisions.