Technical Analysis of NULG 2024-05-10
Overview:
In analyzing the technical indicators for NULG over the last 5 days, we will delve into the trend, momentum, volatility, and volume indicators to provide a comprehensive outlook on the possible stock price movement in the coming days. By examining these key aspects, we aim to offer valuable insights and predictions for informed decision-making.
Trend Analysis:
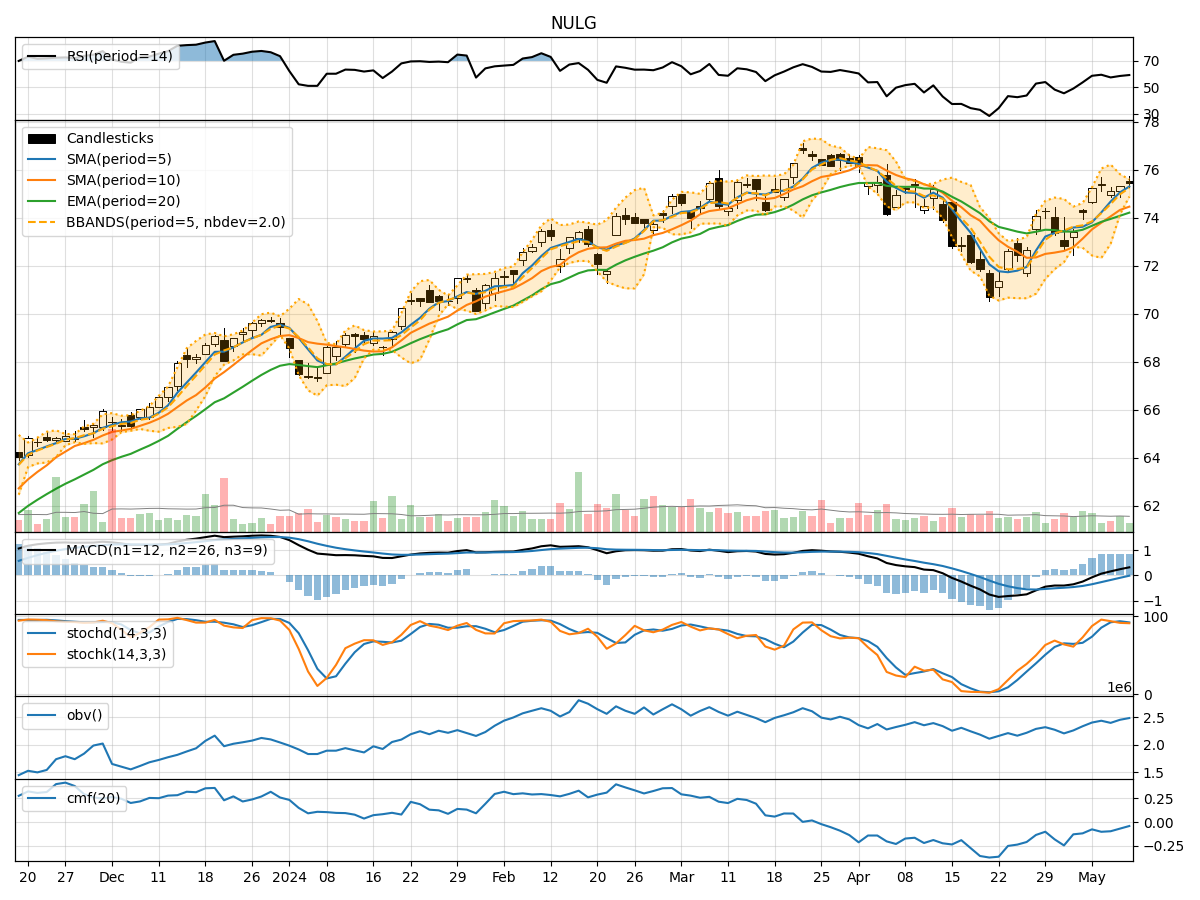
- Moving Averages (MA): The 5-day Moving Average (MA) has been consistently above the Simple Moving Average (SMA) and Exponential Moving Average (EMA), indicating a bullish trend.
- MACD: The MACD line has been consistently above the signal line, with the MACD Histogram showing positive values, suggesting a bullish momentum.
Momentum Analysis:
- RSI: The Relative Strength Index (RSI) has been hovering around the mid-level, indicating a neutral momentum.
- Stochastic Oscillator: Both %K and %D have been fluctuating in the overbought territory, suggesting a potential reversal or consolidation.
Volatility Analysis:
- Bollinger Bands (BB): The stock price has been trading within the Bollinger Bands, with the bands narrowing, indicating decreasing volatility.
- Bollinger %B: The %B indicator has been fluctuating around the mid-level, suggesting a balanced market sentiment.
Volume Analysis:
- On-Balance Volume (OBV): The OBV has been showing a slight decline, indicating some distribution happening in the stock.
- Chaikin Money Flow (CMF): The CMF has been negative, signaling a bearish money flow trend.
Conclusion:
Based on the analysis of the technical indicators, the stock of NULG is currently in a bullish trend with positive momentum indicated by the MACD. However, the neutral RSI and overbought Stochastic Oscillator suggest a possible consolidation or sideways movement in the near term. The decreasing volatility and negative money flow indicated by OBV and CMF also support a cautious outlook.
Recommendation:
Considering the overall technical picture, it is advisable to monitor the stock closely for any signs of a reversal or continuation of the current trend. Traders may consider taking profits if the stock price reaches overbought levels, while investors could wait for a clearer trend confirmation before making significant decisions. It is essential to incorporate risk management strategies and stay updated on market developments to navigate potential price fluctuations effectively.