Technical Analysis of NRGD 2024-05-10
Overview:
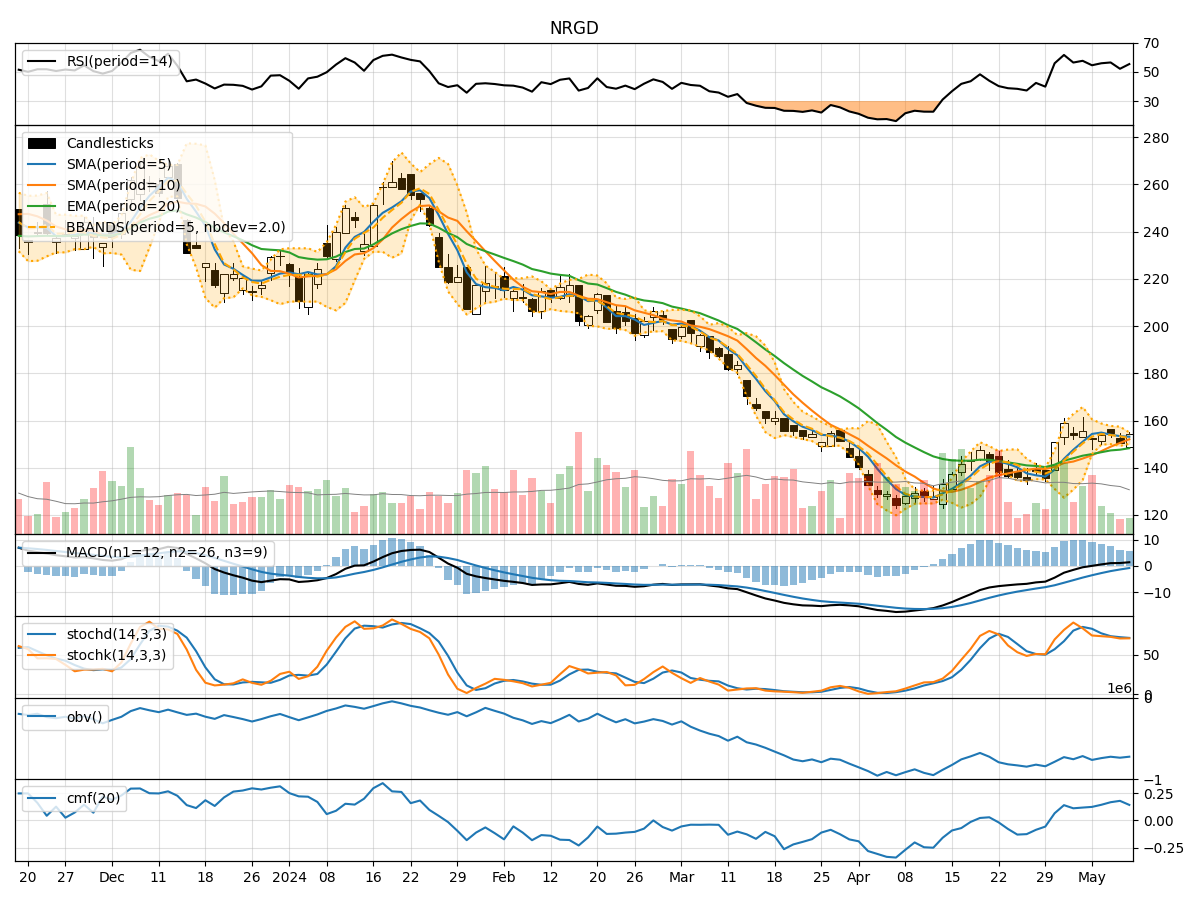
In the last 5 trading days, NRGD stock has shown mixed signals across various technical indicators. The stock price has fluctuated within a range, with some indicators suggesting potential bullish momentum while others indicating a possible consolidation phase. By analyzing trend, momentum, volatility, and volume indicators, we can gain a comprehensive understanding of the stock's potential future price movement.
Trend Indicators:
- Moving averages (MA) show a slight uptrend, with the 5-day MA above the 10-day simple moving average (SMA).
- Exponential moving average (EMA) has been gradually increasing, indicating a positive trend.
- MACD line has been consistently above the signal line, suggesting bullish momentum.
Key Observation: The trend indicators point towards a bullish sentiment in the short term.
Momentum Indicators:
- Relative Strength Index (RSI) has been fluctuating around the neutral zone, indicating indecision in the market.
- Stochastic oscillators show a mixed picture, with %K and %D values hovering around the mid-range.
- Williams %R is in the oversold territory, suggesting a potential buying opportunity.
Key Observation: Momentum indicators reflect a neutral to slightly bullish sentiment.
Volatility Indicators:
- Bollinger Bands (BB) are narrowing, indicating decreasing volatility.
- The lower and upper bands are converging, suggesting a potential breakout or breakdown.
- Bollinger Band %B is fluctuating, indicating uncertainty in price direction.
Key Observation: Volatility indicators signal a potential price breakout due to the narrowing Bollinger Bands.
Volume Indicators:
- On-Balance Volume (OBV) has been fluctuating, indicating mixed buying and selling pressure.
- Chaikin Money Flow (CMF) is positive, suggesting money flow into the stock.
Key Observation: Volume indicators suggest mixed sentiment in terms of buying and selling pressure.
Conclusion:
Based on the analysis of trend, momentum, volatility, and volume indicators, the next few days for NRGD stock are likely to see upward price movement. The bullish trend indicated by moving averages and MACD, coupled with the narrowing Bollinger Bands signaling a potential breakout, support this view. However, the mixed signals from momentum and volume indicators suggest a degree of uncertainty in the market sentiment.
Overall Assessment: The stock is likely to experience upward momentum in the near term, but traders should closely monitor key support and resistance levels for potential reversals. It is advisable to exercise caution and consider implementing risk management strategies to navigate the market uncertainties effectively.