Technical Analysis of NANR 2024-05-31
Overview:
In analyzing the technical indicators for NANR stock over the last 5 days, we will delve into the trend, momentum, volatility, and volume indicators to provide a comprehensive outlook on the possible stock price movement in the upcoming days. By examining these key indicators, we aim to offer valuable insights and predictions for potential investors.
Trend Analysis:
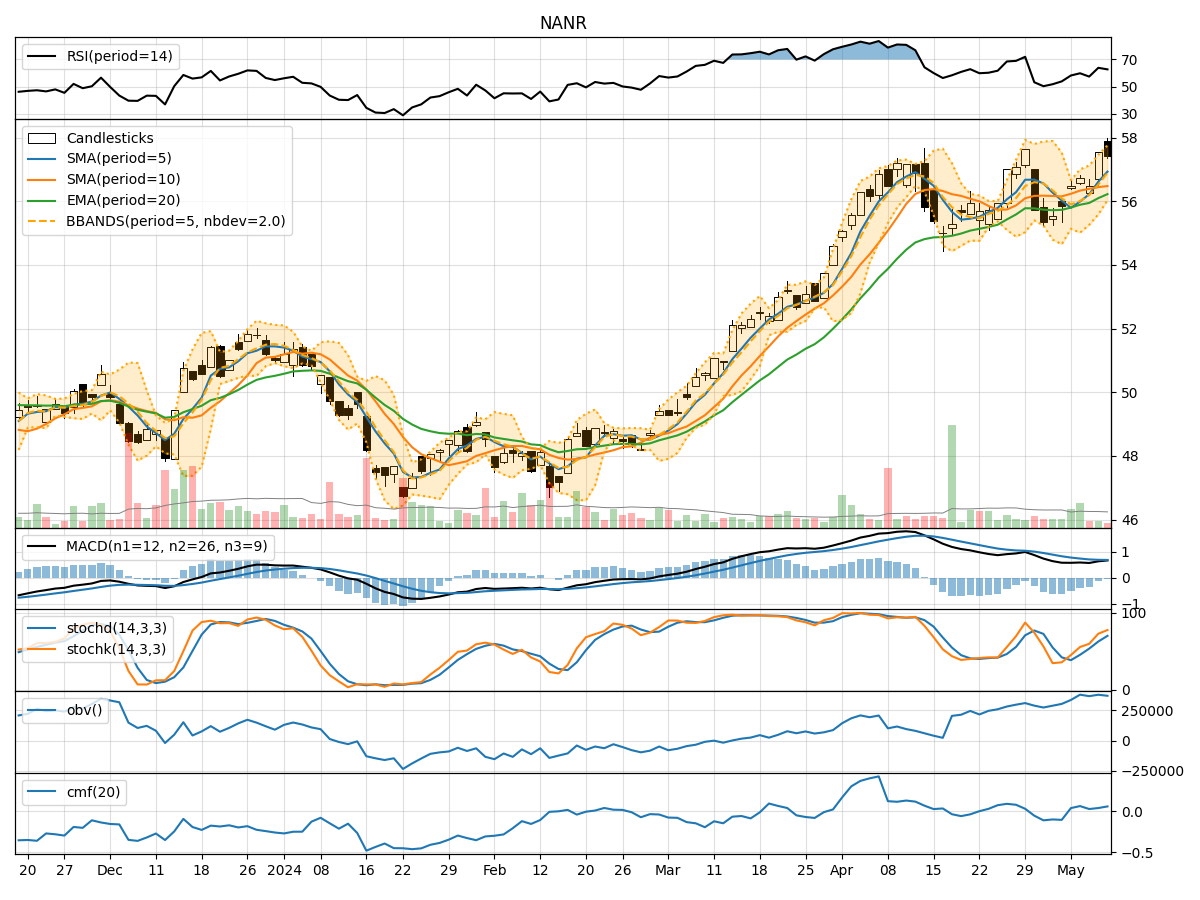
- Moving Averages (MA): The 5-day Moving Average (MA) has been fluctuating around the closing prices, indicating a lack of clear trend direction.
- MACD and Signal Line: The MACD has been consistently below the Signal Line, suggesting a bearish momentum in the short term.
- Relative Strength Index (RSI): The RSI values have been hovering around the mid-range, indicating a neutral sentiment in terms of price momentum.
Momentum Analysis:
- Stochastic Oscillator: The Stochastic Oscillator has shown mixed signals, with values fluctuating between oversold and neutral levels.
- Williams %R (Willr): The Williams %R indicator has been predominantly in the oversold territory, signaling a potential reversal or consolidation phase.
Volatility Analysis:
- Bollinger Bands (BB): The Bollinger Bands have been narrowing, suggesting a decrease in volatility and a possible period of consolidation.
- Bollinger Band %B (bbp): The %B indicator has been fluctuating within a narrow range, indicating a lack of significant price movement.
Volume Analysis:
- On-Balance Volume (OBV): The OBV has shown a slight increase, indicating some accumulation of the stock by investors.
- Chaikin Money Flow (CMF): The CMF has been positive, reflecting buying pressure in the market.
Key Observations:
- The trend indicators suggest a lack of clear direction, with a slightly bearish bias indicated by the MACD.
- Momentum indicators show mixed signals, with potential for a reversal indicated by the Williams %R.
- Volatility indicators point towards a period of consolidation and decreased price movement.
- Volume indicators reflect some accumulation and buying pressure in the market.
Conclusion:
Based on the analysis of the technical indicators, the stock price of NANR is likely to experience sideways movement or consolidation in the upcoming days. The lack of clear trend direction, mixed momentum signals, and decreased volatility indicate a period of indecision in the market. Investors should exercise caution and closely monitor the price action for any potential breakout or trend reversal.