Technical Analysis of MSOS 2024-05-10
Overview:
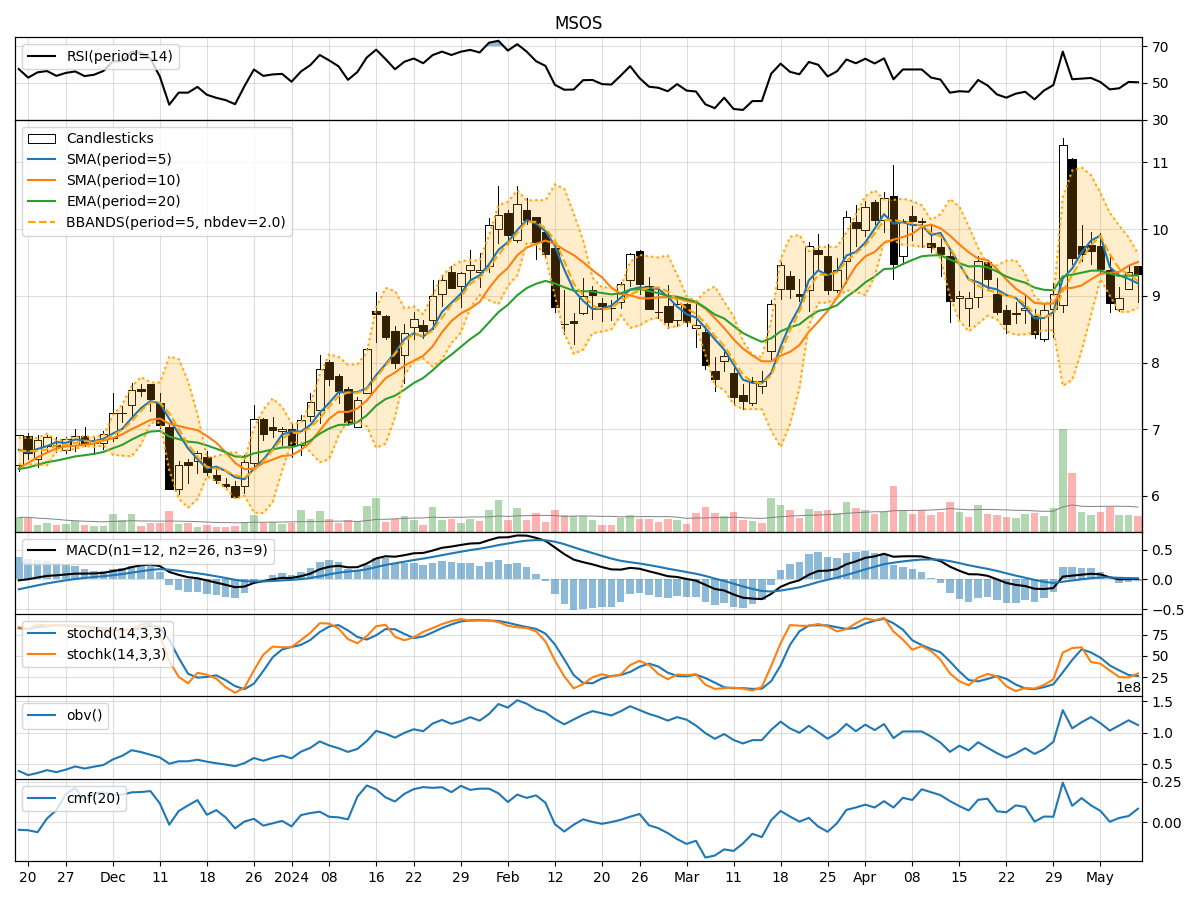
In the last 5 trading days, MSOS has shown mixed signals across various technical indicators. The stock price has fluctuated within a certain range, indicating indecision in the market. By analyzing trend, momentum, volatility, and volume indicators, we can gain insights into the potential future price movement of MSOS.
Trend Analysis:
- Moving averages (MA) show a downward trend, with the 5-day MA consistently below the 10-day simple moving average (SMA).
- Exponential moving average (EMA) has been declining, indicating a bearish trend.
- MACD line has been below the signal line, suggesting a bearish momentum.
- Overall, the trend indicators point towards a bearish outlook for MSOS.
Momentum Analysis:
- Relative Strength Index (RSI) has been hovering around the 50 level, indicating a lack of strong momentum in either direction.
- Stochastic oscillators show oversold conditions but have not yet shown a clear signal for a reversal.
- Williams %R is in the oversold territory, suggesting a potential bounce, but confirmation is needed.
- Momentum indicators suggest a neutral stance with a slight bullish bias due to the oversold conditions.
Volatility Analysis:
- Bollinger Bands have been narrowing, indicating decreasing volatility.
- The lower Bollinger Band has been acting as a support level.
- Bollinger Band %B is above 0.5, suggesting a potential move towards the upper band.
- Volatility indicators point towards a sideways movement with a potential for a volatility expansion.
Volume Analysis:
- On-Balance Volume (OBV) has been fluctuating, indicating indecision among investors.
- Chaikin Money Flow (CMF) has been positive but not significantly strong.
- Volume indicators suggest a neutral sentiment with no clear direction.
Conclusion:
Based on the analysis of trend, momentum, volatility, and volume indicators, the next few days for MSOS are likely to see sideways consolidation with a bearish bias. The lack of strong trend confirmation, mixed momentum signals, and stable volume indicate a period of indecision and potential range-bound trading. Traders should exercise caution and wait for clearer signals before taking significant positions.