Technical Analysis of MSFU 2024-05-10
Overview:
In analyzing the technical indicators for MSFU over the last 5 days, we will delve into the trend, momentum, volatility, and volume indicators to provide a comprehensive outlook on the possible stock price movement in the coming days.
Trend Analysis:
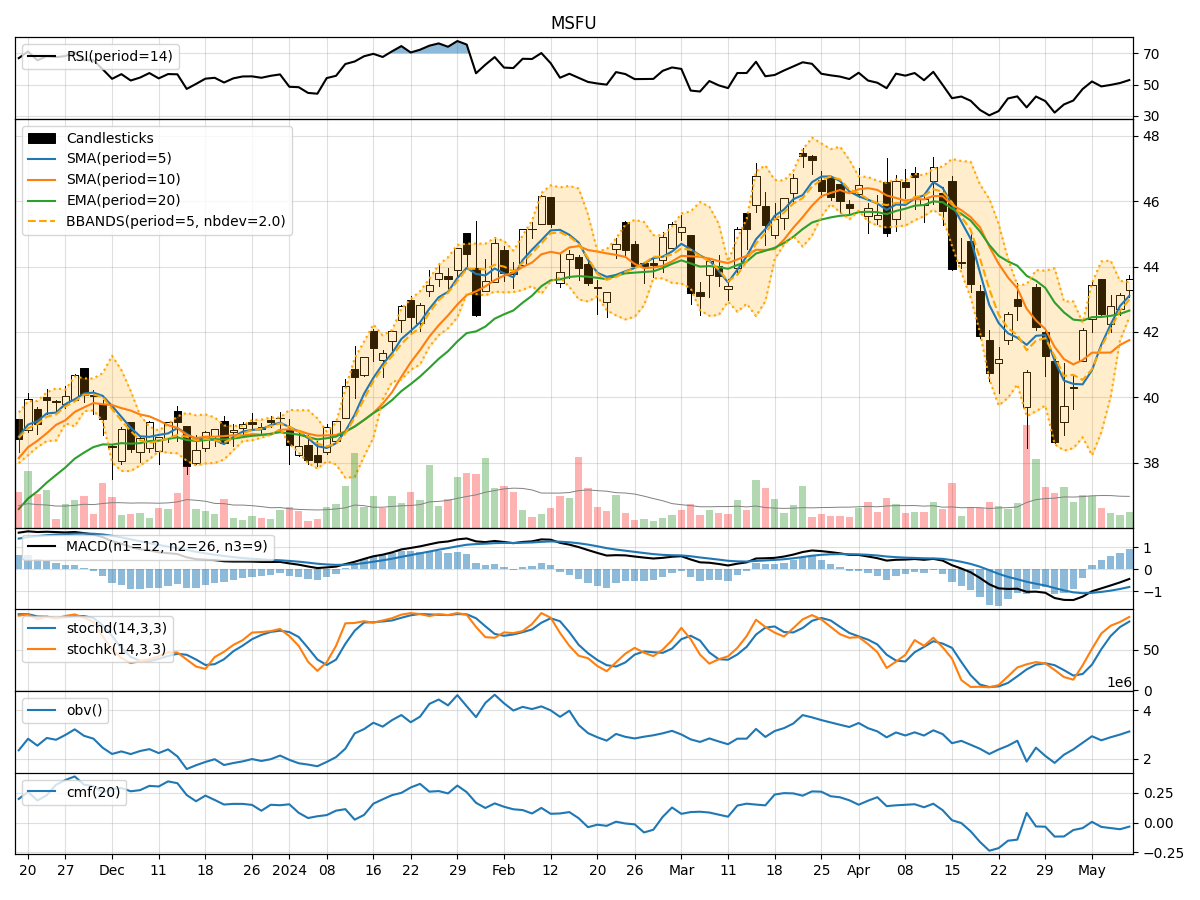
- Moving Averages (MA): The 5-day Moving Average has been consistently above the closing prices, indicating a short-term uptrend.
- MACD: The MACD line has been negative but showing signs of convergence towards the signal line, suggesting a potential reversal in the downtrend.
- RSI: The Relative Strength Index has been hovering around the neutral zone, indicating a balanced market sentiment.
Momentum Analysis:
- Stochastic Oscillator: Both %K and %D have been in the overbought zone, signaling a potential reversal or consolidation.
- Williams %R: The Williams %R is close to the oversold territory, indicating a possible buying opportunity.
Volatility Analysis:
- Bollinger Bands: The stock price has been trading within the bands, suggesting a period of consolidation.
- BB%: The Bollinger Band %B is above 0.5, indicating a bullish momentum.
Volume Analysis:
- On-Balance Volume (OBV): The OBV has been declining, indicating selling pressure in the stock.
- Chaikin Money Flow (CMF): The CMF has been negative, suggesting outflow of money from the stock.
Key Observations:
- The trend indicators show a potential reversal in the downtrend.
- Momentum indicators suggest a possible consolidation or reversal.
- Volatility indicators point towards a period of consolidation.
- Volume indicators indicate selling pressure and outflow of money from the stock.
Conclusion:
Based on the analysis of the technical indicators, the next few days' possible stock price movement for MSFU is likely to be sideways with a slight bullish bias. Traders should watch for a potential reversal in the downtrend indicated by the MACD and Stochastic Oscillator, while also considering the consolidation phase suggested by the Bollinger Bands. It is essential to monitor the volume closely for any shifts in market sentiment. Overall, a cautious approach with a focus on key support and resistance levels is recommended.