Technical Analysis of MBB 2024-05-10
Overview:
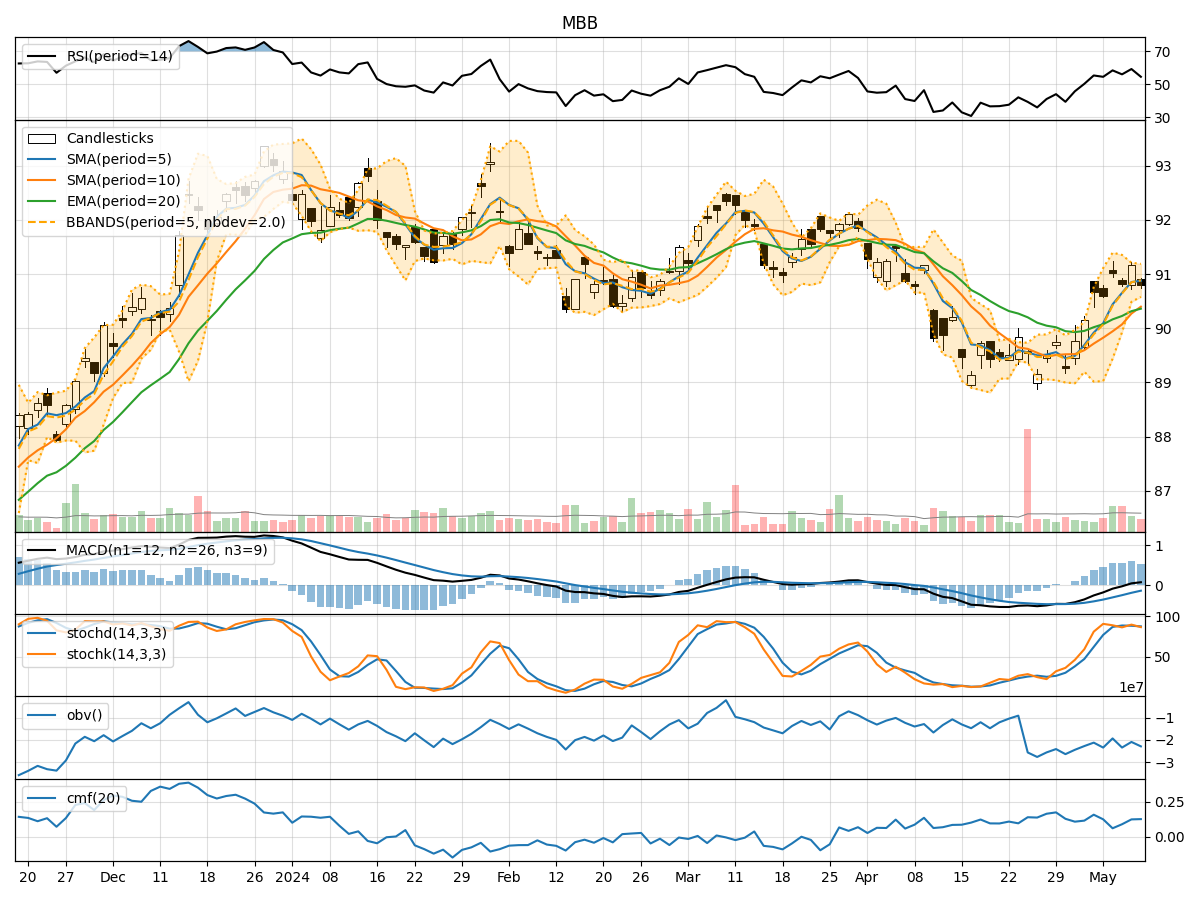
In analyzing the technical indicators for MBB over the last 5 days, we will delve into the trend, momentum, volatility, and volume indicators to provide a comprehensive outlook on the possible stock price movement in the coming days. By examining these key indicators, we aim to offer valuable insights and predictions for informed decision-making.
Trend Analysis:
- Moving Averages (MA): The 5-day MA has been consistently above the closing prices, indicating a short-term uptrend.
- MACD: The MACD line has been positive, suggesting bullish momentum.
- RSI: The RSI values have been fluctuating around the neutral zone, indicating indecision in the market sentiment.
Key Observation: The trend indicators suggest a slightly bullish sentiment in the short term.
Momentum Analysis:
- Stochastic Oscillator: The Stochastic Oscillator values have been fluctuating but generally staying within the overbought territory.
- Williams %R (WillR): The Williams %R values have been consistently in the oversold territory.
Key Observation: Momentum indicators show mixed signals with a slight bias towards overbought conditions.
Volatility Analysis:
- Bollinger Bands (BB): The price has been mostly within the Bollinger Bands, indicating moderate volatility.
- BB% (BB Percentage): The BB% values have been fluctuating around the midline, suggesting a lack of extreme price movements.
Key Observation: Volatility indicators point towards a stable price movement with no significant spikes expected.
Volume Analysis:
- On-Balance Volume (OBV): The OBV values have been fluctuating, indicating mixed buying and selling pressure.
- Chaikin Money Flow (CMF): The CMF values have been positive, suggesting a slight inflow of money into the stock.
Key Observation: Volume indicators reflect a neutral stance with no clear dominance of buying or selling pressure.
Conclusion:
Based on the analysis of the technical indicators, the next few days for MBB stock price movement are likely to be sideways with a slight bullish bias. The trend indicators suggest a continuation of the short-term uptrend, while momentum indicators show mixed signals leaning towards overbought conditions. Volatility indicators point towards stable price movements, and volume indicators indicate a balanced buying and selling pressure.
Overall Assessment: The stock is expected to consolidate in the near term with a potential for a slight upward movement. Traders may consider maintaining a cautious approach and closely monitor key support and resistance levels for potential trading opportunities.