Technical Analysis of LRND 2024-05-10
Overview:
In analyzing the technical indicators for LRND over the last 5 days, we will delve into the trend, momentum, volatility, and volume indicators to provide a comprehensive assessment of the stock's potential price movement. By examining these key factors, we aim to offer valuable insights and predictions for the next few days.
Trend Analysis:
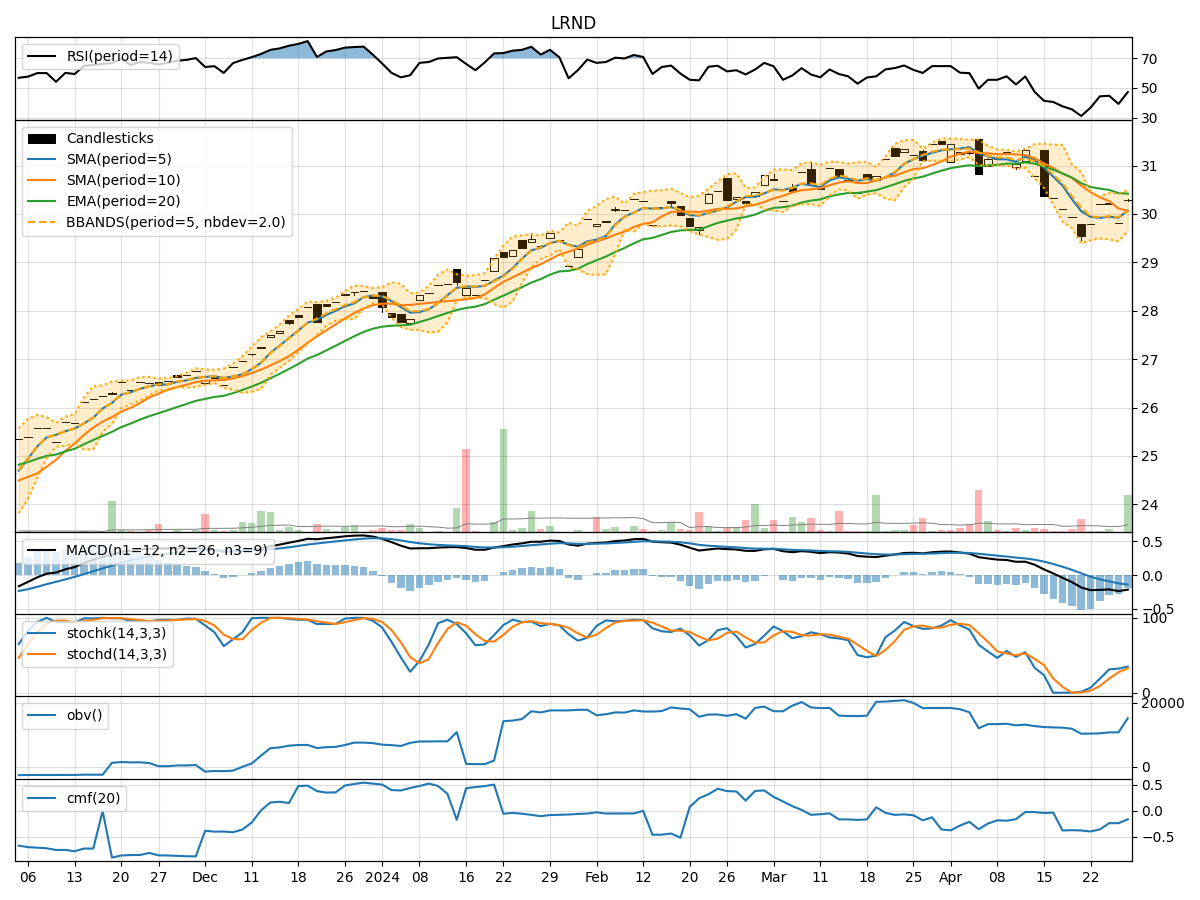
- Moving Averages (MA): The 5-day Moving Average (MA) has been consistently above the Simple Moving Average (SMA) and Exponential Moving Average (EMA), indicating a bullish trend.
- MACD: The Moving Average Convergence Divergence (MACD) has shown positive values, with the MACD line consistently above the Signal line, suggesting upward momentum.
Momentum Analysis:
- RSI: The Relative Strength Index (RSI) has been fluctuating around the 50 level, indicating a neutral momentum.
- Stochastic Oscillator: Both %K and %D have been hovering around the overbought zone, suggesting a potential reversal or consolidation.
Volatility Analysis:
- Bollinger Bands (BB): The stock price has mostly remained within the Bollinger Bands, with the bands narrowing, indicating decreasing volatility.
Volume Analysis:
- On-Balance Volume (OBV): The OBV has shown mixed movements, reflecting indecision among market participants.
- Chaikin Money Flow (CMF): The CMF has been positive, indicating buying pressure in the stock.
Key Observations:
- The trend indicators suggest a bullish sentiment, supported by the positive MACD values.
- Momentum indicators show a neutral stance, with the RSI around the midpoint and stochastic oscillators near overbought levels.
- Volatility has been decreasing, as seen in the narrowing Bollinger Bands.
- Volume indicators reflect mixed signals, with OBV showing inconsistent movements and CMF indicating buying pressure.
Conclusion:
Based on the analysis of the technical indicators, the next few days for LRND could see sideways consolidation with a slight upward bias. The bullish trend indicated by moving averages and MACD may support some upward movement, but the neutral momentum and mixed volume signals suggest a lack of strong conviction in either direction. Traders should closely monitor key levels and wait for clearer signals before making significant trading decisions.