Technical Analysis of LRGC 2024-05-10
Overview:
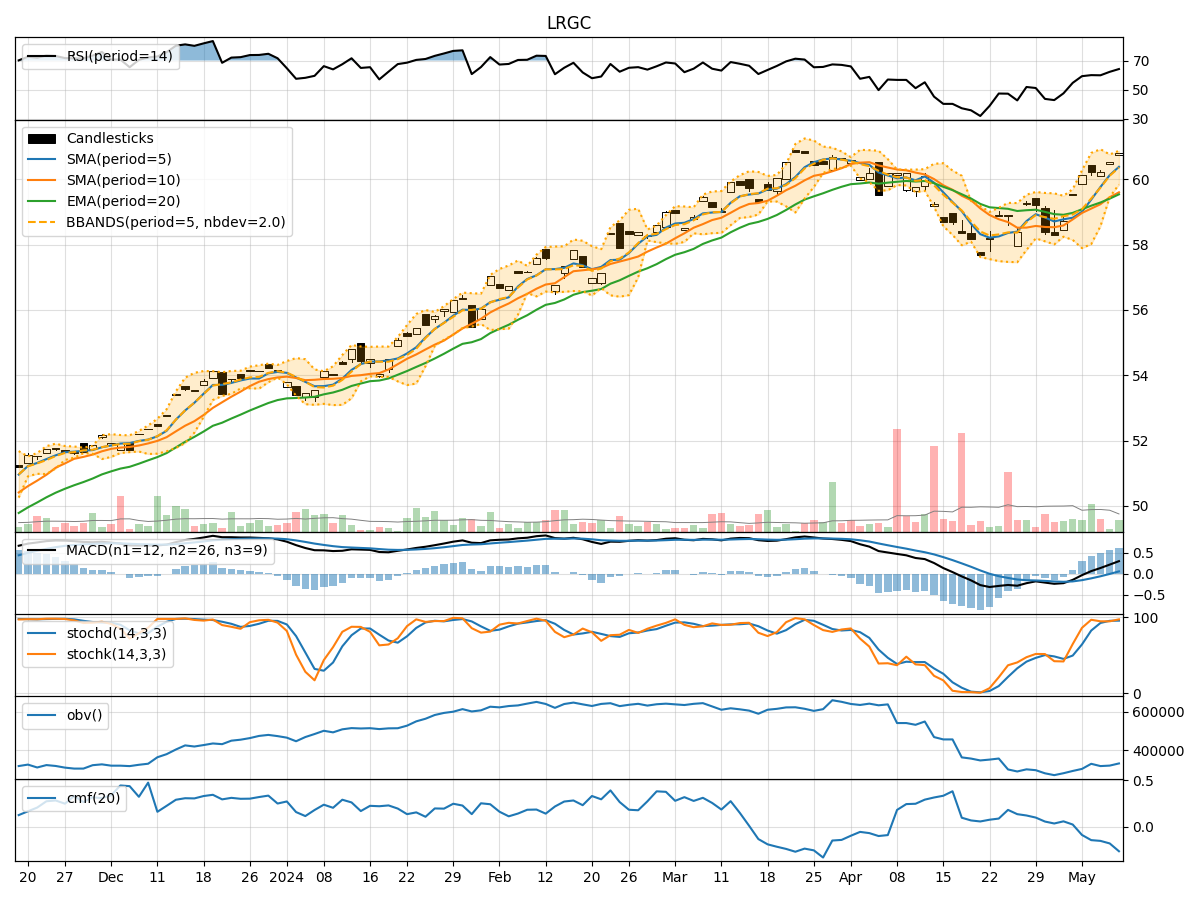
In analyzing the technical indicators for LRGC stock over the last 5 days, we will delve into the trends, momentum, volatility, and volume indicators to provide a comprehensive outlook on the possible stock price movement in the coming days. By examining key metrics such as moving averages, MACD, RSI, Bollinger Bands, and OBV, we aim to offer valuable insights and predictions for potential price action.
Trend Indicators:
- Moving Averages (MA): The 5-day MA has been consistently above the 10-day SMA, indicating a short-term bullish trend.
- MACD: The MACD line has been trending upwards, with the MACD histogram showing positive values, suggesting increasing bullish momentum.
- EMA: The EMA has been steadily rising, reflecting a positive trend in the stock price.
Momentum Indicators:
- RSI: The RSI has been in overbought territory, indicating strong buying pressure and potential for a pullback.
- Stochastic Oscillator: Both %K and %D have been in the overbought zone, signaling a potential reversal in the short term.
- Williams %R: The indicator has been hovering around the oversold region, suggesting a possible reversal to the upside.
Volatility Indicators:
- Bollinger Bands: The stock price has been trading within the bands, indicating a period of consolidation and potential breakout in either direction.
- Bollinger %B: The %B indicator has been fluctuating around the midline, suggesting a lack of clear trend direction.
- Average True Range (ATR): ATR has been relatively stable, indicating consistent price movement without significant volatility spikes.
Volume Indicators:
- On-Balance Volume (OBV): The OBV has been declining, suggesting distribution and potential selling pressure in the stock.
- Chaikin Money Flow (CMF): The CMF has been negative, indicating outflows and bearish sentiment in the market.
Key Observations:
- The stock is currently in a short-term bullish trend based on moving averages and MACD.
- Momentum indicators suggest a potential reversal or pullback due to overbought conditions.
- Volatility indicators point towards a period of consolidation and indecision in the market.
- Volume indicators indicate selling pressure and bearish sentiment among investors.
Conclusion:
Based on the analysis of technical indicators, the next few days for LRGC stock could see a potential pullback or consolidation as momentum indicators signal overbought conditions and volume indicators show selling pressure. Traders should exercise caution and consider waiting for clearer signals before making significant trading decisions.