Technical Analysis of LQDH 2024-05-10
Overview:
In analyzing the technical indicators for LQDH over the last 5 days, we will delve into the trend, momentum, volatility, and volume indicators to provide a comprehensive assessment of the stock's potential price movement. By examining these key factors, we aim to offer valuable insights and predictions for the next few days.
Trend Analysis:
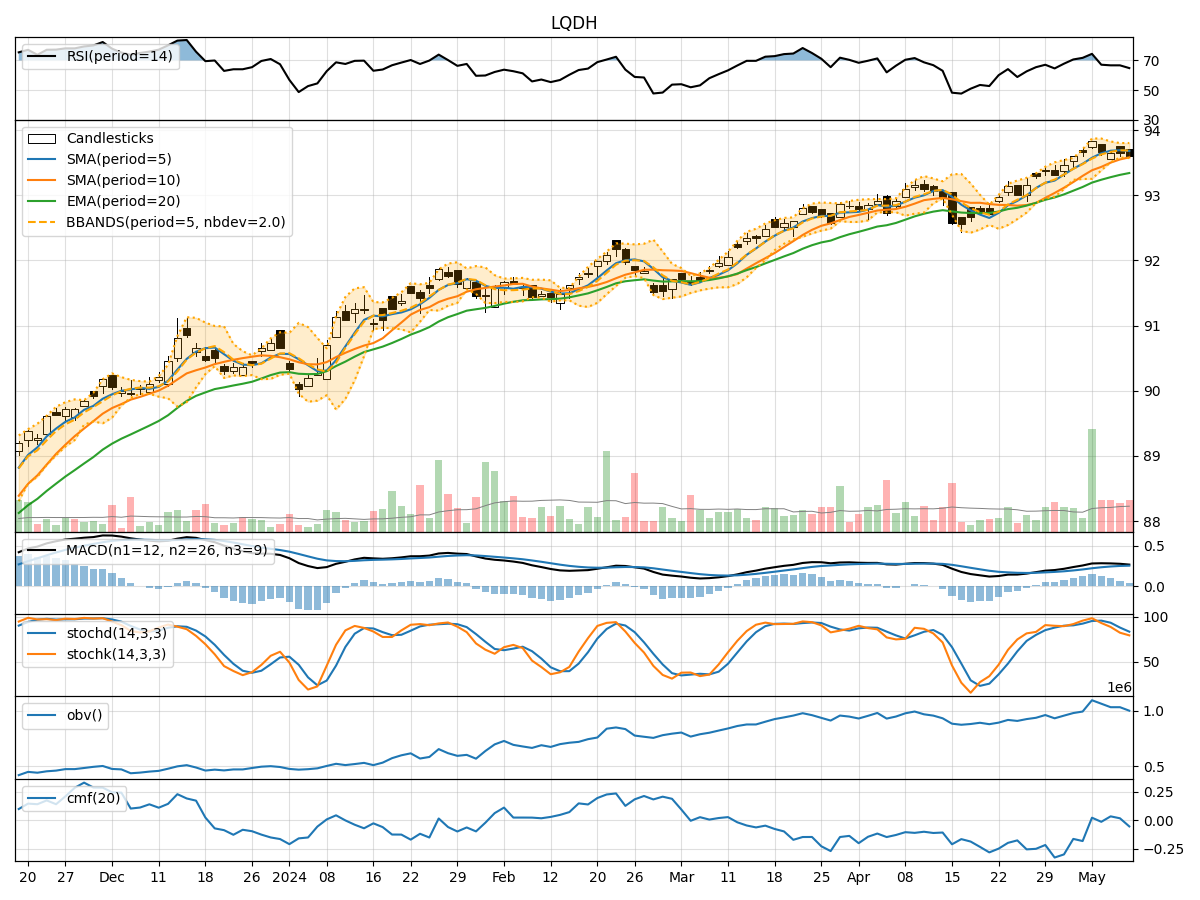
- Moving Averages (MA): The 5-day Moving Average (MA) has been consistently above the Simple Moving Average (SMA) and Exponential Moving Average (EMA), indicating a bullish trend.
- MACD: The MACD line has been above the signal line, with both lines showing an upward trend, suggesting bullish momentum.
- Conclusion: The trend indicators point towards an upward movement in the stock price.
Momentum Analysis:
- RSI: The Relative Strength Index (RSI) has been fluctuating but generally staying above 50, indicating bullish momentum.
- Stochastic Oscillator: Both %K and %D have been decreasing, moving towards the oversold territory, suggesting a potential reversal.
- Conclusion: The momentum indicators show a mixed signal, with RSI indicating bullish momentum and Stochastic Oscillator signaling a possible reversal.
Volatility Analysis:
- Bollinger Bands (BB): The stock price has been trading within the Bollinger Bands, with the bands narrowing, indicating decreasing volatility.
- Conclusion: The volatility indicators suggest a sideways movement or potential consolidation in the stock price.
Volume Analysis:
- On-Balance Volume (OBV): The OBV has been fluctuating but has not shown a clear trend, indicating indecision among investors.
- Chaikin Money Flow (CMF): The CMF has been positive, suggesting buying pressure in the stock.
- Conclusion: The volume indicators reflect mixed signals, with OBV showing indecision and CMF indicating buying pressure.
Overall Conclusion:
Based on the analysis of trend, momentum, volatility, and volume indicators, the next few days' possible stock price movement for LQDH is likely to be upward. The bullish trend indicated by moving averages and MACD, coupled with positive momentum from RSI, outweighs the mixed signals from Stochastic Oscillator. The decreasing volatility suggests a potential consolidation phase, while the volume indicators show a mix of indecision and buying pressure. Therefore, investors should consider a bullish view for the next few days, but remain cautious of potential reversals indicated by the Stochastic Oscillator.