Technical Analysis of LQDB 2024-05-10
Overview:
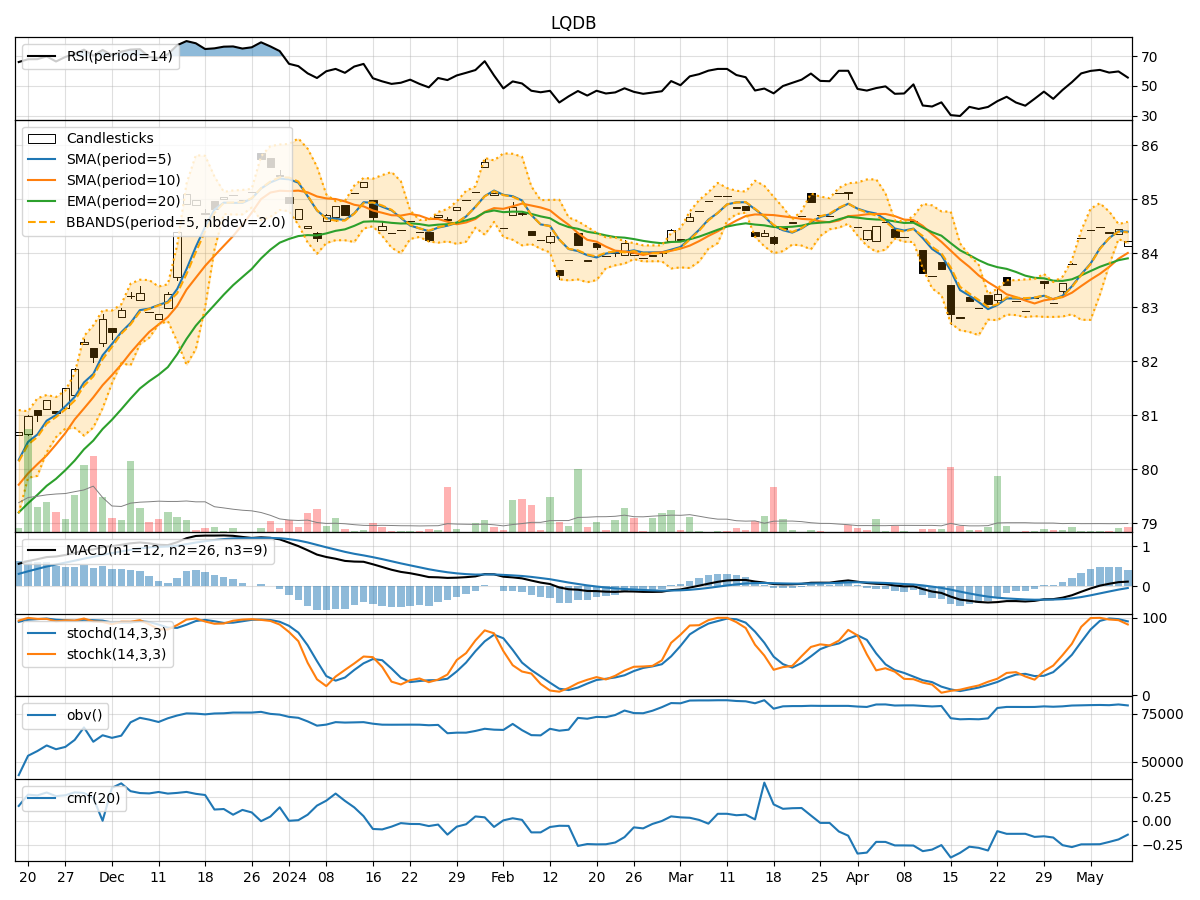
In the last 5 trading days, LQDB stock has shown a relatively stable price movement around the $84 level. Various technical indicators have been analyzed to provide insights into the potential future price movement of the stock. The analysis includes trend indicators, momentum indicators, volatility indicators, and volume indicators.
Trend Indicators:
- Moving Averages (MA): The 5-day Moving Average (MA) has been consistently above the Simple Moving Average (SMA) and Exponential Moving Average (EMA), indicating a short-term uptrend.
- MACD: The MACD line has been consistently above the signal line, suggesting a bullish momentum in the stock price.
- RSI: The Relative Strength Index (RSI) has been fluctuating around the 50 level, indicating a neutral stance in terms of momentum.
Momentum Indicators:
- Stochastic Oscillator: The Stochastic Oscillator has been in the overbought territory, suggesting a potential reversal or consolidation in the near future.
- Williams %R: The Williams %R indicator has been in the oversold territory, indicating a potential buying opportunity.
Volatility Indicators:
- Bollinger Bands: The Bollinger Bands have been relatively narrow, indicating low volatility in the stock price.
- Average True Range (ATR): The ATR value has been decreasing, suggesting a decrease in price volatility.
Volume Indicators:
- On-Balance Volume (OBV): The OBV indicator has been relatively stable, indicating a balance between buying and selling pressure.
- Chaikin Money Flow (CMF): The CMF has been negative, suggesting a net outflow of money from the stock.
Key Observations and Opinions:
- Trend: The stock is currently in an upward trend based on moving averages and MACD.
- Momentum: The momentum indicators suggest a mixed outlook with the Stochastic Oscillator in overbought territory and Williams %R in oversold territory.
- Volatility: The stock is experiencing low volatility based on Bollinger Bands and ATR.
- Volume: The volume indicators show a neutral stance with OBV indicating balance and CMF showing a net outflow.
Conclusion:
Based on the analysis of the technical indicators, the next few days' possible stock price movement for LQDB is likely to be sideways with a slight upward bias. The stock may consolidate around the current price level of $84 before potentially making a modest move higher. Traders should monitor the Stochastic Oscillator for a potential reversal signal and the OBV for any significant shifts in buying or selling pressure.