Technical Analysis of LOCT 2024-05-10
Overview:
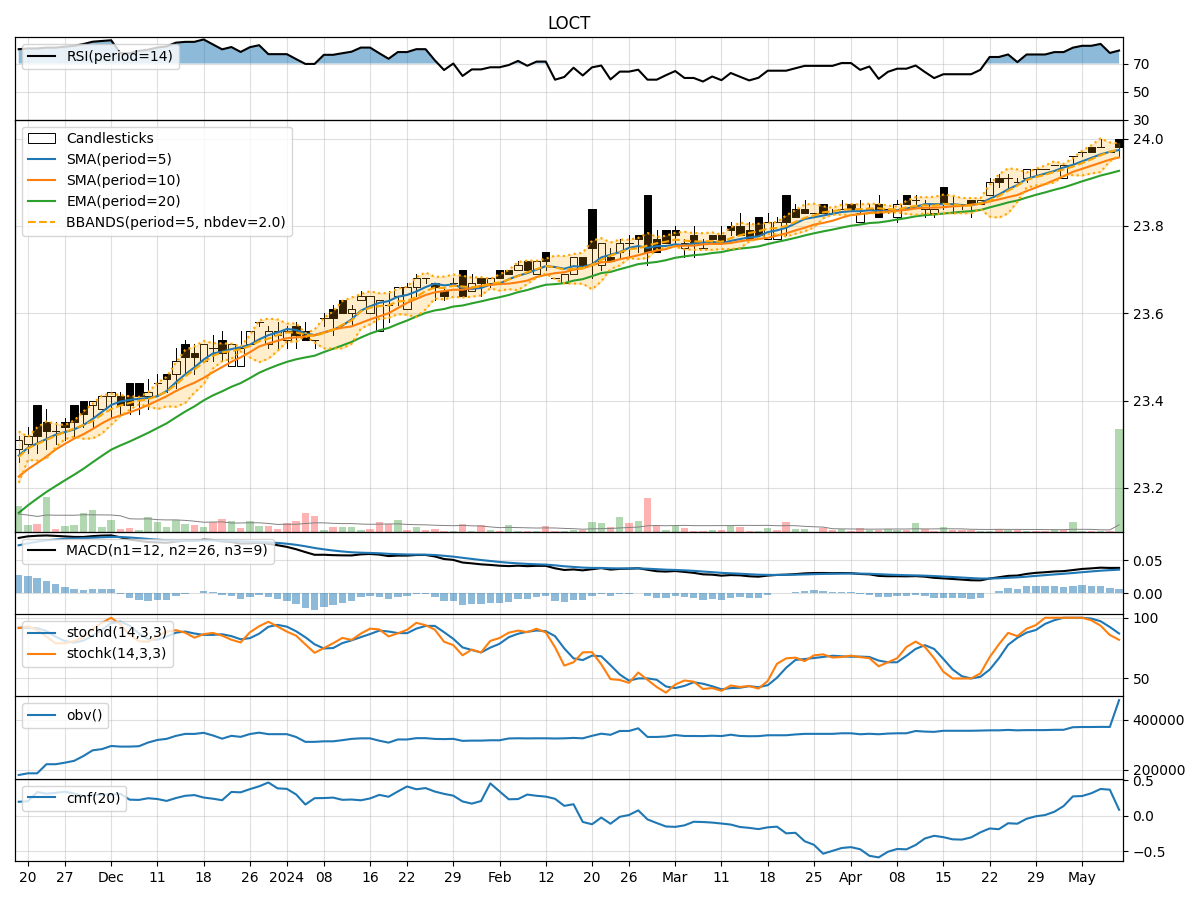
In analyzing the technical indicators for LOCT stock over the last 5 days, we will delve into the trend, momentum, volatility, and volume indicators to provide a comprehensive outlook on the possible stock price movement in the coming days. By examining these key indicators, we aim to offer valuable insights and predictions to guide your investment decisions.
Trend Analysis:
- Moving Averages (MA): The 5-day MA has been consistently above the closing prices, indicating a short-term uptrend.
- MACD: The MACD line has been positive and above the signal line, suggesting bullish momentum.
- EMA: The EMA has been trending upwards, supporting the bullish sentiment.
Key Observation: The trend indicators point towards an upward trend in the stock price.
Momentum Analysis:
- RSI: The RSI has been in the overbought territory, indicating strong buying momentum.
- Stochastic Oscillator: Both %K and %D have been declining but remain in the overbought zone.
- Williams %R: The indicator has been fluctuating but generally in the oversold region.
Key Observation: Momentum indicators suggest a potential consolidation or a slight pullback in the stock price.
Volatility Analysis:
- Bollinger Bands (BB): The stock price has been trading within the bands, with the %B indicator hovering around the midline.
- Volatility: The volatility has been relatively stable over the past few days.
Key Observation: Volatility indicators imply a sideways movement or consolidation in the stock price.
Volume Analysis:
- On-Balance Volume (OBV): The OBV has shown mixed signals, with some days seeing increased volume accumulation.
- Chaikin Money Flow (CMF): The CMF has been fluctuating but generally positive, indicating buying pressure.
Key Observation: Volume indicators suggest mixed sentiment in terms of volume accumulation.
Conclusion:
Based on the analysis of the technical indicators, the stock of LOCT is likely to experience upward movement in the coming days, supported by the bullish trend indicators. However, the momentum indicators hint at a possible consolidation or pullback in the short term. Volatility indicators point towards a sideways movement or consolidation, while volume indicators show mixed sentiment.
Recommendation:
Considering the overall analysis, it is advisable to monitor the stock closely for any signs of reversal or continuation of the current trend. Investors may consider buying on dips or waiting for a clear breakout above key resistance levels before entering a position. It is essential to set stop-loss orders to manage risk effectively.
Disclaimer:
This analysis is based solely on technical indicators and historical data. Market conditions can change rapidly, and unforeseen events may impact stock prices. It is crucial to conduct thorough research and consider other fundamental factors before making investment decisions. Consulting with a financial advisor is recommended for personalized guidance tailored to your investment goals and risk tolerance level.