Technical Analysis of LBO 2024-05-10
Overview:
In analyzing the provided Technical Analysis (TA) data for the last 5 days of LBO stock, we will delve into the trend, momentum, volatility, and volume indicators to derive insights into the possible future stock price movement. By examining these key indicators, we aim to provide a comprehensive and well-informed prediction for the upcoming days.
Trend Analysis:
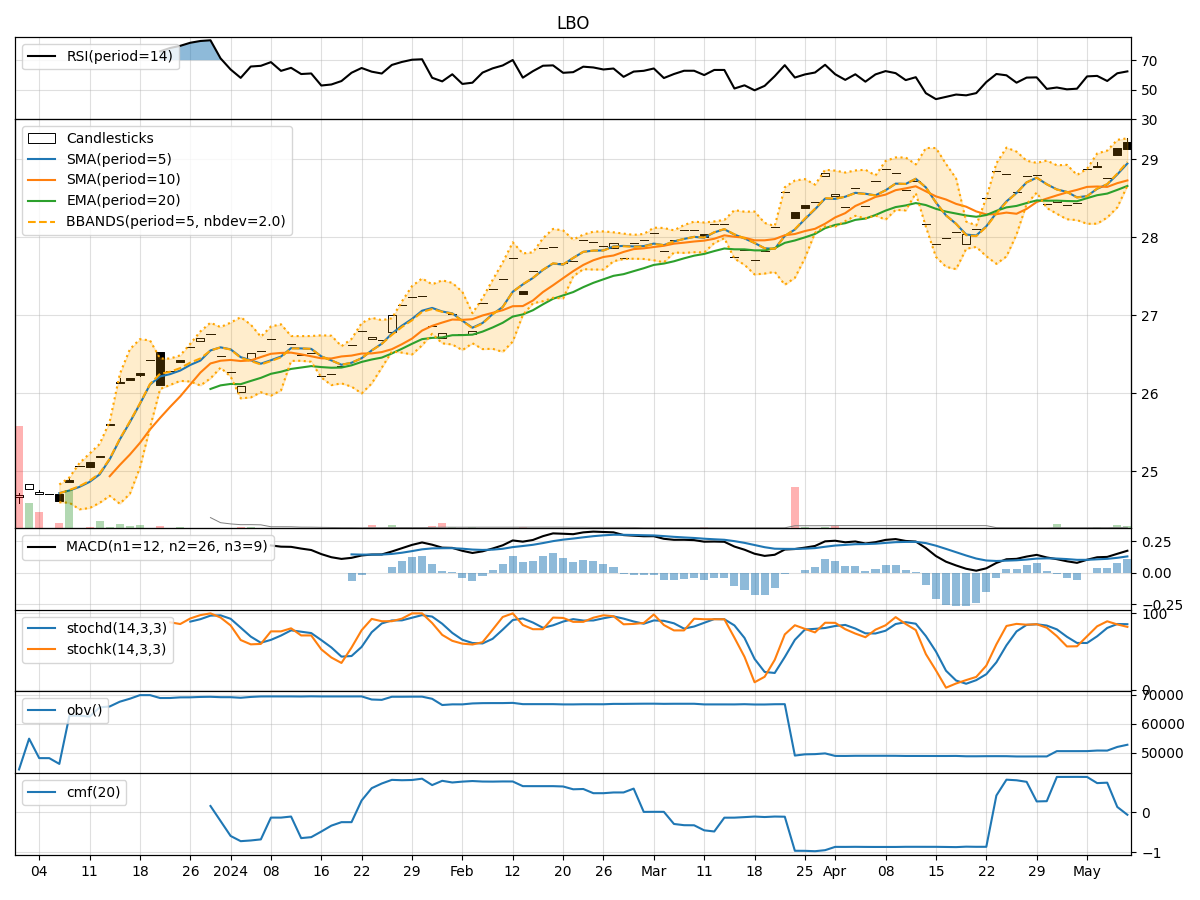
- Moving Averages (MA): The 5-day Moving Average (MA) has been consistently rising, indicating a positive trend in the stock price.
- MACD: The Moving Average Convergence Divergence (MACD) and its signal line have been increasing, suggesting bullish momentum.
Momentum Analysis:
- RSI: The Relative Strength Index (RSI) has been fluctuating around the neutral level, indicating indecision in the market.
- Stochastic Oscillator: Both %K and %D have been declining, signaling a potential bearish momentum.
Volatility Analysis:
- Bollinger Bands (BB): The Bollinger Bands have been narrowing, suggesting decreasing volatility in the stock price.
Volume Analysis:
- On-Balance Volume (OBV): The OBV has been showing a slight decrease, indicating some selling pressure.
- Chaikin Money Flow (CMF): The CMF has been positive but declining, signaling a potential decrease in buying pressure.
Key Observations:
- The trend indicators show a bullish sentiment with rising moving averages and MACD.
- Momentum indicators present a mixed picture with RSI indicating neutrality and Stochastic Oscillator hinting at bearish momentum.
- Volatility has been decreasing based on the narrowing Bollinger Bands.
- Volume indicators suggest a slight decrease in buying pressure as OBV is negative and CMF is declining.
Conclusion:
Based on the analysis of the technical indicators, the next few days' possible stock price movement for LBO is likely to be sideways with a slight bearish bias. The bullish trend indicators may support some upward movement, but the mixed momentum signals and decreasing buying pressure indicate a potential consolidation or minor downward correction in the stock price. Traders should exercise caution and closely monitor the evolving market dynamics to make informed decisions.