Technical Analysis of KNG 2024-05-10
Overview:
In analyzing the technical indicators for KNG stock over the last 5 days, we will delve into the trend, momentum, volatility, and volume indicators to provide a comprehensive outlook on the possible stock price movement in the coming days. By examining these key indicators, we aim to offer valuable insights and predictions for informed decision-making.
Trend Indicators:
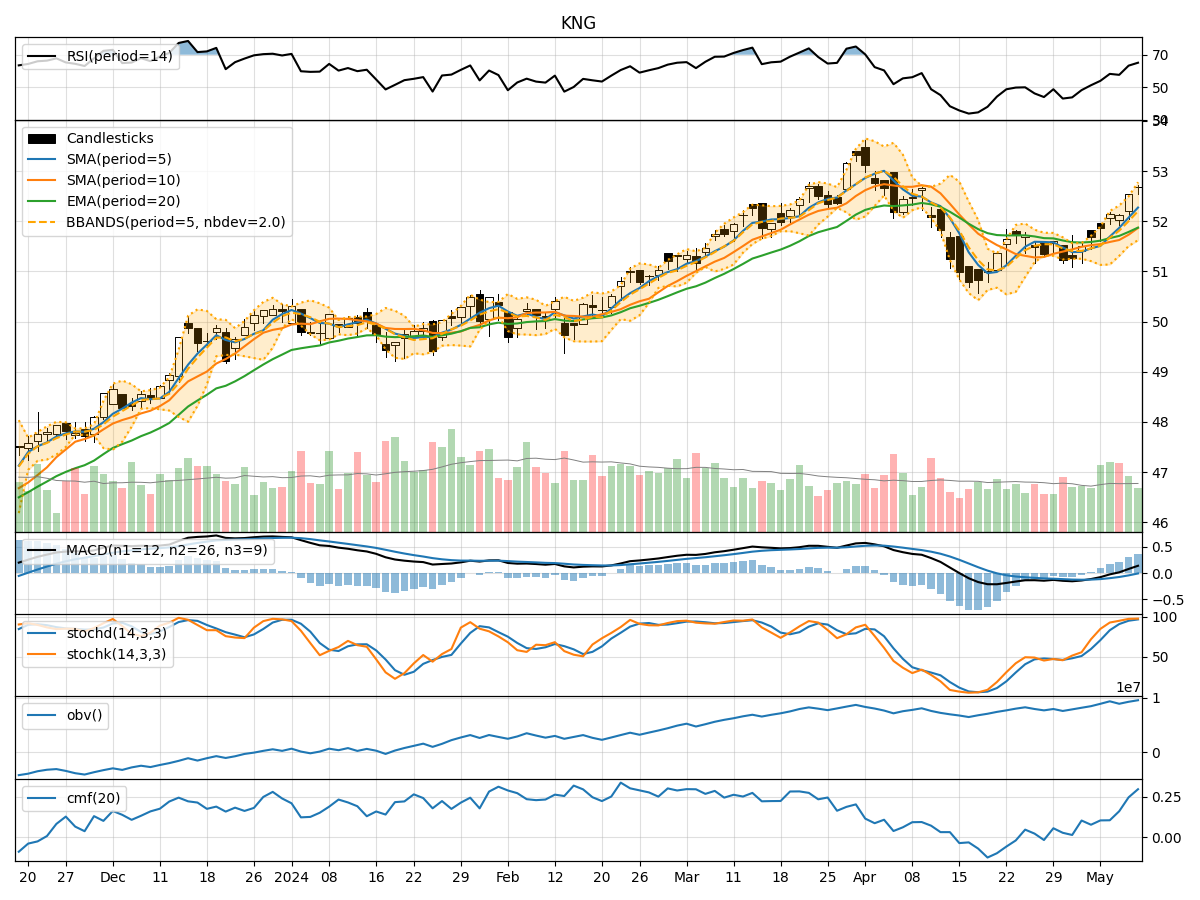
- Moving Averages (MA): The 5-day MA has been consistently above the 10-day SMA, indicating a short-term bullish trend. The EMA(20) has shown a gradual uptrend, suggesting positive momentum in the stock price.
- MACD: The MACD line has been above the signal line for the past 5 days, with the MACD histogram showing an increasing trend, signaling bullish momentum.
Momentum Indicators:
- RSI: The RSI has been in the overbought territory, indicating strong buying pressure and potential overheating in the stock.
- Stochastic Oscillator: Both %K and %D have been in the overbought zone, suggesting a potential reversal or consolidation in the stock price.
- Williams %R: The Williams %R has been fluctuating around the oversold region, indicating potential buying opportunities.
Volatility Indicators:
- Bollinger Bands: The stock price has been trading within the upper Bollinger Band, indicating an overbought condition. The narrowing of the bands suggests a potential decrease in volatility.
- Bollinger %B: The %B indicator has been hovering above 0.8, indicating a high price relative to the upper band and a possible pullback in the stock price.
Volume Indicators:
- On-Balance Volume (OBV): The OBV has shown a positive trend, indicating accumulation of the stock by investors.
- Chaikin Money Flow (CMF): The CMF has been steadily increasing, suggesting strong buying pressure and positive money flow into the stock.
Key Observations:
- The stock is currently in an overbought condition based on RSI and Stochastic indicators.
- The trend indicators suggest a bullish momentum in the short term.
- Volatility indicators point towards a decrease in volatility and a potential price consolidation.
- Volume indicators indicate accumulation and positive money flow into the stock.
Conclusion:
Based on the analysis of the technical indicators, the next few days' possible stock price movement for KNG is likely to experience a short-term consolidation or a slight pullback due to the overbought conditions indicated by the momentum indicators. However, the overall trend remains bullish, supported by the moving averages and MACD. Traders should exercise caution and consider potential profit-taking opportunities in the near term.