Technical Analysis of KCE 2024-05-10
Overview:
In analyzing the technical indicators for KCE stock over the last 5 days, we will delve into the trend, momentum, volatility, and volume indicators to provide a comprehensive outlook on the possible stock price movement in the coming days. By examining these key indicators, we aim to offer valuable insights and predictions for potential investors.
Trend Indicators:
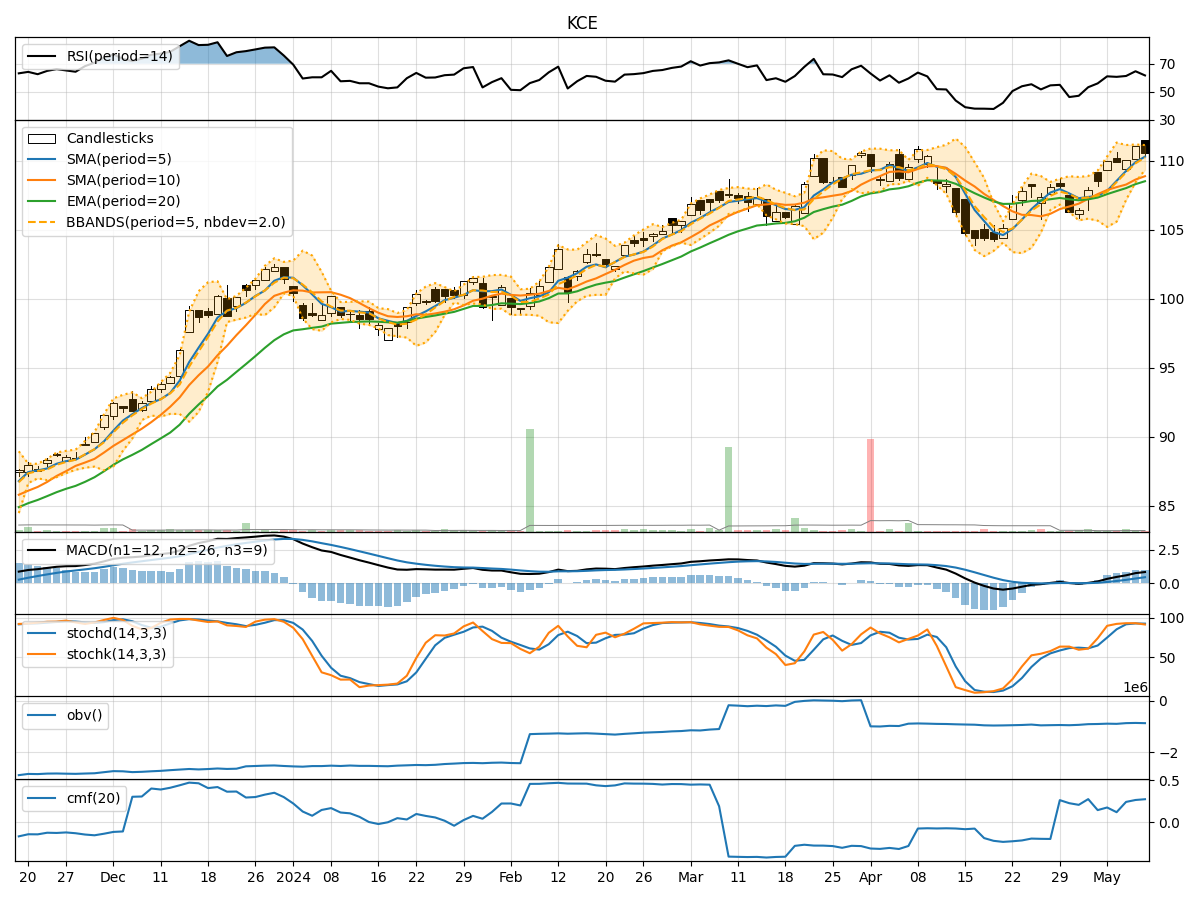
- Moving Averages (MA): The 5-day MA has been consistently above the longer-term SMAs and EMAs, indicating a bullish trend.
- MACD: The MACD line has been above the signal line, suggesting positive momentum in the stock price.
- MACD Histogram: The histogram has been mostly positive, indicating increasing bullish momentum.
Momentum Indicators:
- RSI: The RSI has been fluctuating around the overbought territory, suggesting a strong bullish momentum.
- Stochastic Oscillator: Both %K and %D have been in the overbought zone, indicating a potential reversal or consolidation.
- Williams %R: The indicator has been in the oversold territory, signaling a potential buying opportunity.
Volatility Indicators:
- Bollinger Bands: The stock price has mostly stayed within the bands, indicating moderate volatility.
- Bollinger %B: The %B has been fluctuating around the middle range, suggesting a balanced market sentiment.
Volume Indicators:
- On-Balance Volume (OBV): The OBV has shown a slight increase, indicating accumulation by investors.
- Chaikin Money Flow (CMF): The CMF has been positive, suggesting buying pressure in the stock.
Key Observations:
- The trend indicators point towards a bullish sentiment with moving averages and MACD supporting an upward trend.
- Momentum indicators show a mixed signal with RSI indicating strength but stochastic oscillators hinting at a potential reversal.
- Volatility indicators suggest moderate price fluctuations with Bollinger Bands containing the price movements.
- Volume indicators reflect positive accumulation and buying pressure in the stock.
Conclusion:
Based on the analysis of the technical indicators, the next few days for KCE stock could see further upside potential driven by the bullish trend and positive momentum. However, caution is advised as the stochastic oscillators signal a possible reversal, indicating a need for vigilance in monitoring the stock price movement. Overall, the outlook remains bullish with a potential for continued upward movement in the stock price.