Technical Analysis of KBE 2024-05-10
Overview:
In analyzing the technical indicators for KBE over the last 5 days, we will delve into the trend, momentum, volatility, and volume indicators to provide a comprehensive outlook on the possible stock price movement. By examining these key aspects, we aim to offer valuable insights and predictions for the upcoming days.
Trend Analysis:
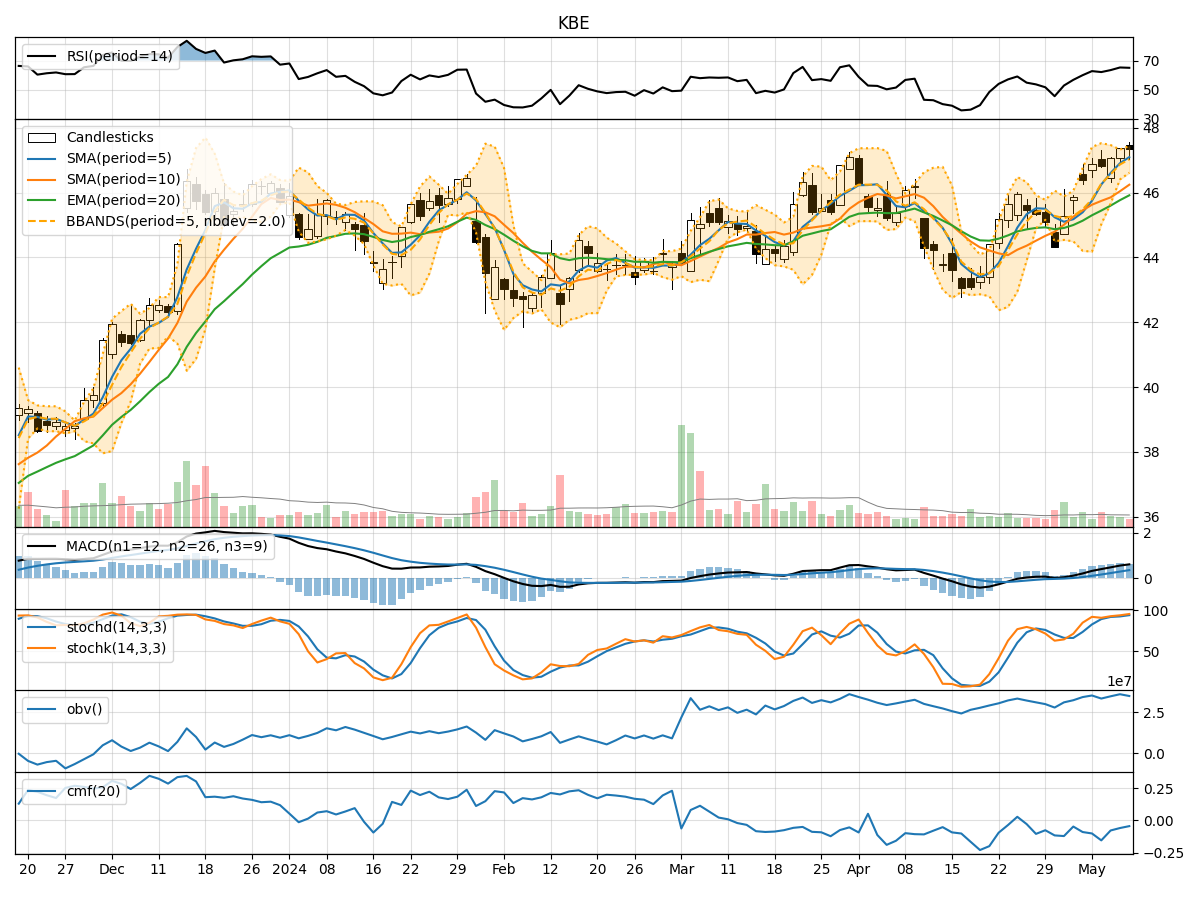
- Moving Averages (MA): The 5-day Moving Average has been consistently rising, indicating a bullish trend in the short term.
- MACD: The MACD line has been above the signal line, suggesting positive momentum in the stock price.
- EMA: The Exponential Moving Average has also been trending upwards, supporting the bullish sentiment.
Momentum Analysis:
- RSI: The Relative Strength Index has been in the overbought territory, signaling a strong bullish momentum.
- Stochastic Oscillator: Both %K and %D have been in the overbought zone, indicating a potential reversal or consolidation.
- Williams %R: The indicator has been in the oversold region, suggesting a possible reversal in the short term.
Volatility Analysis:
- Bollinger Bands: The bands have been narrowing, indicating decreasing volatility and a potential breakout in the near future.
- Bollinger %B: The %B indicator has been fluctuating within a narrow range, suggesting a period of consolidation.
Volume Analysis:
- On-Balance Volume (OBV): The OBV has been fluctuating, indicating indecision among investors regarding the stock.
- Chaikin Money Flow (CMF): The CMF has been negative, reflecting selling pressure in the stock.
Key Observations:
- The trend indicators suggest a bullish sentiment in the short term, supported by moving averages and MACD.
- Momentum indicators show a strong bullish momentum but also hint at potential overbought conditions.
- Volatility indicators point towards a period of consolidation with a potential breakout.
- Volume indicators reflect indecision among investors and selling pressure in the stock.
Conclusion:
Based on the analysis of the technical indicators, the next few days' possible stock price movement for KBE is likely to be sideways with a bullish bias. While the trend and momentum indicators support a bullish outlook, the overbought conditions and selling pressure indicated by some momentum and volume indicators suggest a possible consolidation phase. Traders should closely monitor key levels and wait for confirmation of a breakout or reversal before making trading decisions.