Technical Analysis of JUST 2024-05-10
Overview:
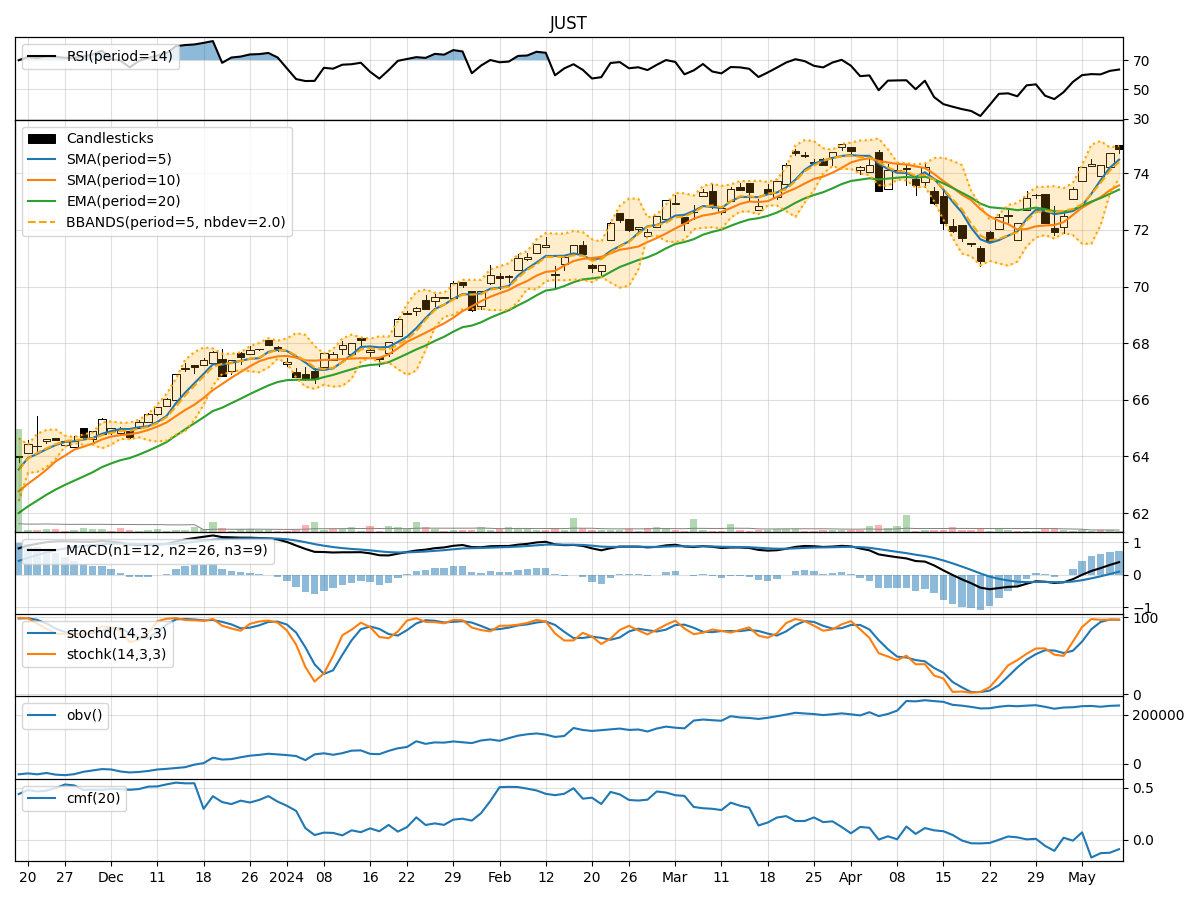
In the last 5 trading days, the stock has shown a consistent uptrend in both price and volume. The moving averages have been trending upwards, indicating a bullish sentiment. Momentum indicators like RSI and Stochastic oscillators suggest the stock is in overbought territory but still showing strength. Volatility indicators show a narrowing of the Bollinger Bands, indicating a potential decrease in volatility. Volume indicators have been mixed, with the On-Balance Volume (OBV) showing slight accumulation while the Chaikin Money Flow (CMF) is negative.
Trend Indicators Analysis:
- Moving Averages (MA): The stock price has been consistently above the 5-day MA, indicating a short-term bullish trend.
- MACD: The MACD line has been above the signal line, showing positive momentum.
- MACD Histogram: The histogram has been increasing, indicating strengthening bullish momentum.
Momentum Indicators Analysis:
- RSI: The RSI is in overbought territory, suggesting a potential pullback or consolidation.
- Stochastic Oscillators: Both %K and %D are in overbought territory, signaling a potential reversal.
- Williams %R: The stock is in oversold territory, indicating a potential reversal.
Volatility Indicators Analysis:
- Bollinger Bands: The bands are narrowing, suggesting a decrease in volatility and a possible period of consolidation.
- Bollinger %B: The %B is above 0.8, indicating the stock is trading near the upper band.
Volume Indicators Analysis:
- On-Balance Volume (OBV): The OBV has been slightly increasing, showing some accumulation.
- Chaikin Money Flow (CMF): The CMF is negative, indicating selling pressure.
Key Observations:
- The stock is currently in overbought territory based on RSI and Stochastic indicators.
- The narrowing Bollinger Bands suggest a potential period of consolidation or a decrease in volatility.
- The OBV shows slight accumulation, but the CMF indicates selling pressure.
Conclusion:
Based on the technical indicators and analysis: - Short-Term View: The stock may experience a short-term pullback or consolidation due to overbought conditions indicated by RSI and Stochastic oscillators. - Medium- to Long-Term View: The overall trend remains bullish based on moving averages and MACD, but caution is advised due to the overbought signals in momentum indicators. - Overall Assessment: The stock is likely to enter a period of consolidation or a minor correction before potentially resuming its uptrend. Traders should watch for signs of a reversal in momentum indicators before considering new long positions.
Recommendation:
- Short-Term Traders: Consider taking profits or tightening stop-loss levels to protect gains during the potential pullback.
- Long-Term Investors: Hold positions but monitor closely for any signs of a trend reversal.
- Risk Management: Implement proper risk management strategies to navigate the current market conditions.
Key Conclusion:
- Overall Sentiment: The stock is likely to experience a short-term correction or consolidation before potentially resuming its bullish trend. Caution is advised due to overbought conditions in momentum indicators.