Technical Analysis of JSI 2024-05-10
Overview:
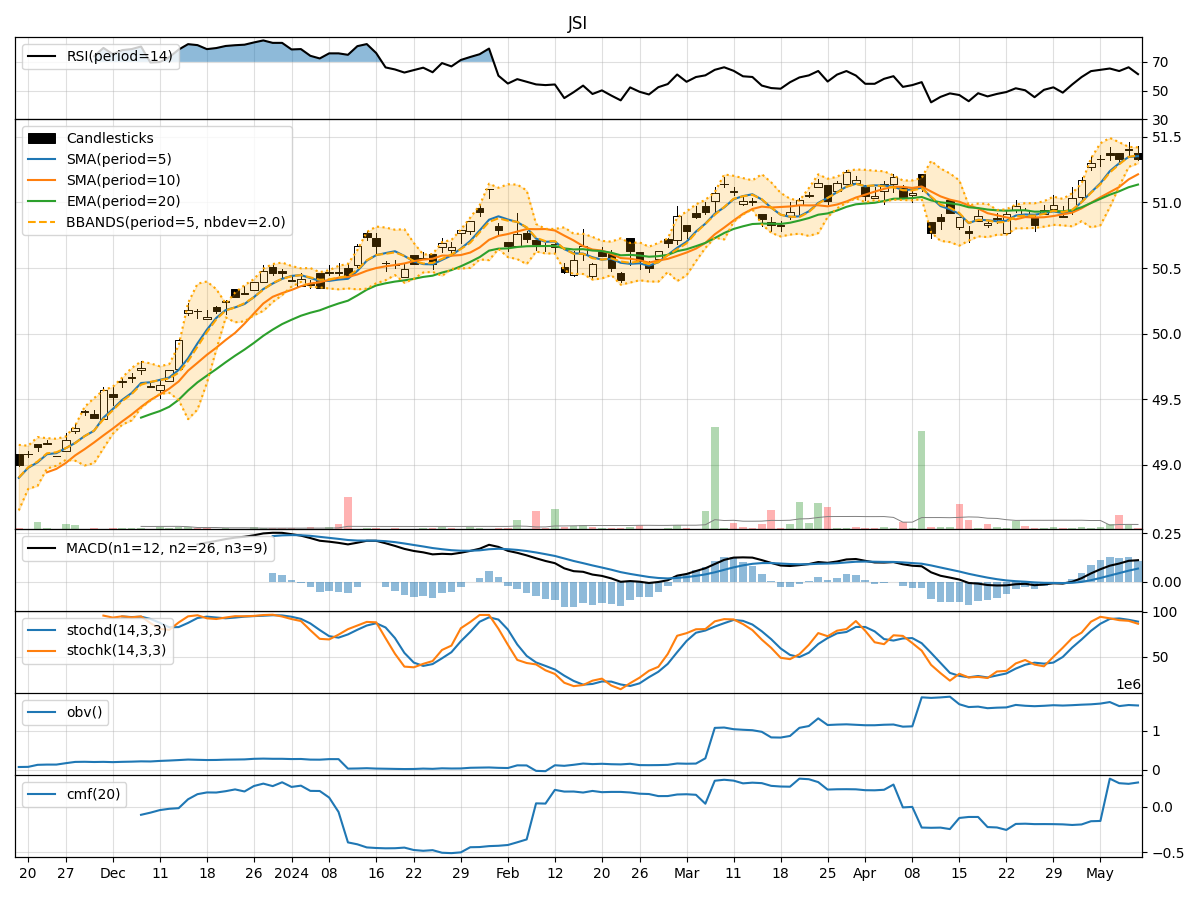
In analyzing the technical indicators for JSI over the last 5 days, we will delve into the trend, momentum, volatility, and volume indicators to provide a comprehensive outlook on the possible stock price movement in the coming days. By examining these key aspects, we aim to offer valuable insights and predictions for potential investors.
Trend Indicators:
- Moving Averages (MA): The 5-day MA has been consistently above the closing prices, indicating a short-term uptrend.
- MACD: The MACD line has been above the signal line, suggesting bullish momentum.
- EMA: The EMA has been trending upwards, supporting the bullish sentiment.
Key Observation: The trend indicators point towards an upward trend in the stock price.
Momentum Indicators:
- RSI: The RSI has been in the overbought territory, indicating strong buying momentum.
- Stochastic Oscillator: Both %K and %D have been relatively high, signaling potential overbought conditions.
- Williams %R: The indicator has been in the oversold region, suggesting a possible reversal.
Key Observation: Momentum indicators suggest a mixed sentiment with potential for a pullback.
Volatility Indicators:
- Bollinger Bands: The stock price has been trading within the bands, indicating stable volatility.
- Bollinger %B: The %B has been fluctuating around the midline, reflecting consolidation.
- Bollinger Band Width: The band width has been relatively narrow, suggesting low volatility.
Key Observation: Volatility indicators point towards consolidation and a sideways movement.
Volume Indicators:
- On-Balance Volume (OBV): The OBV has shown mixed signals with fluctuations in volume accumulation.
- Chaikin Money Flow (CMF): The CMF has been positive, indicating buying pressure.
Key Observation: Volume indicators suggest mixed volume activity with a slight bullish bias.
Conclusion:
Based on the analysis of the technical indicators, the stock of JSI is likely to experience upward price movement in the coming days, supported by the bullish trend indicators. However, the momentum indicators signal a potential pullback due to overbought conditions. Volatility indicators point towards consolidation and a sideways trend, while volume indicators show a mixed volume activity with a slight bullish bias.
Recommendation:
Considering the overall analysis, it is advisable to exercise caution and closely monitor the stock price for any signs of a reversal or consolidation. Investors may consider taking profits if the stock price continues to rise, while also being prepared for a possible pullback based on the momentum indicators. Conducting further research and staying updated on market developments is crucial for making informed investment decisions.