Technical Analysis of JPLD 2024-05-10
Overview:
In analyzing the technical indicators for JPLD over the last 5 days, we will delve into the trend, momentum, volatility, and volume indicators to provide a comprehensive outlook on the possible stock price movement in the coming days. By examining these key aspects, we aim to offer valuable insights and predictions to guide investment decisions.
Trend Analysis:
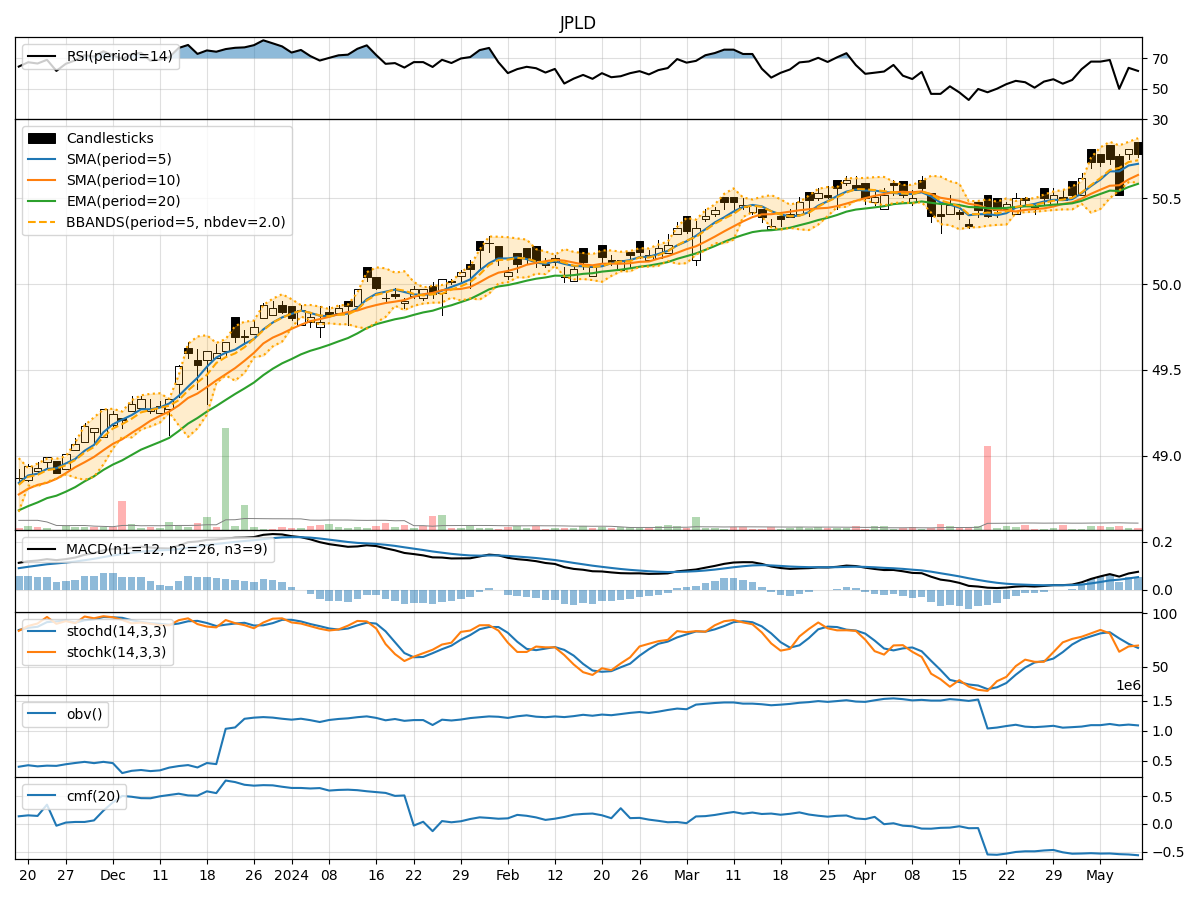
- Moving Averages (MA): The 5-day moving average has been relatively stable around the mid $50 range, indicating a neutral trend.
- MACD: The MACD line has shown a slight positive trend, with the MACD histogram also displaying an uptrend, suggesting a potential bullish momentum.
Momentum Analysis:
- RSI: The Relative Strength Index (RSI) has been fluctuating within the neutral range, indicating indecision in the market.
- Stochastic Oscillator: Both %K and %D have been hovering around the mid-level, suggesting a lack of strong momentum.
Volatility Analysis:
- Bollinger Bands (BB): The Bollinger Bands have shown a narrowing of the bands, indicating decreasing volatility and a potential upcoming price breakout.
Volume Analysis:
- On-Balance Volume (OBV): The OBV has been on a downtrend, suggesting selling pressure in the market.
- Chaikin Money Flow (CMF): The CMF has been consistently negative, indicating a bearish sentiment.
Key Observations:
- The trend indicators suggest a neutral to slightly bullish outlook.
- Momentum indicators show a lack of strong buying or selling pressure.
- Volatility is decreasing, potentially leading to a breakout.
- Volume indicators point towards selling pressure in the market.
Conclusion:
Based on the analysis of the technical indicators, the next few days for JPLD stock price movement could see sideways consolidation with a slight bullish bias. Traders should closely monitor the narrowing Bollinger Bands for a potential breakout, while also keeping an eye on the OBV and CMF for any shifts in market sentiment. It is advisable to exercise caution and wait for clearer signals before making significant trading decisions.