Technical Analysis of JMSI 2024-05-10
Overview:
In analyzing the technical indicators for JMSI over the last 5 days, we will delve into the trend, momentum, volatility, and volume indicators to provide a comprehensive outlook on the possible stock price movement in the coming days. By examining these key aspects, we aim to offer valuable insights and predictions to guide your investment decisions.
Trend Indicators:
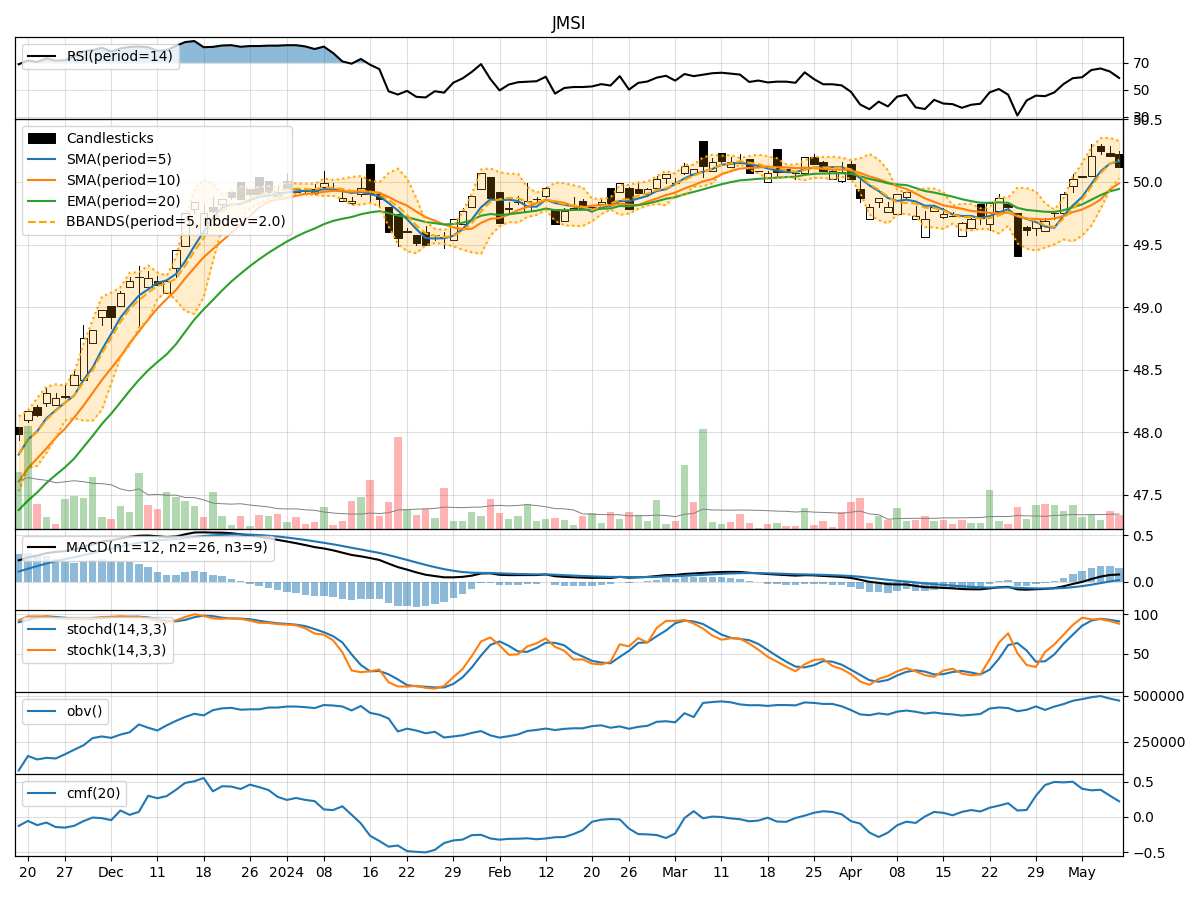
- Moving Averages (MA): The 5-day moving average has been consistently above the simple moving average (SMA) and exponential moving average (EMA), indicating a short-term uptrend.
- MACD: The MACD line has been consistently above the signal line, suggesting bullish momentum in the stock.
- MACD Histogram: The MACD histogram has been increasing over the past few days, indicating strengthening bullish momentum.
Momentum Indicators:
- RSI: The Relative Strength Index (RSI) has been fluctuating around the overbought territory, suggesting a strong bullish momentum.
- Stochastic Oscillator: Both %K and %D lines of the Stochastic Oscillator have been in the overbought zone, indicating a potential reversal or consolidation.
- Williams %R: The Williams %R has been in the oversold territory, signaling a possible reversal to the upside.
Volatility Indicators:
- Bollinger Bands: The stock price has been trading within the Bollinger Bands, with the bands narrowing, indicating decreasing volatility.
- Bollinger %B: The %B indicator has been hovering around the middle range, suggesting a neutral stance in terms of volatility.
Volume Indicators:
- On-Balance Volume (OBV): The OBV has been fluctuating, indicating mixed buying and selling pressure.
- Chaikin Money Flow (CMF): The CMF has been positive but decreasing, suggesting a potential decrease in buying pressure.
Key Observations:
- The trend indicators point towards a bullish sentiment in the short term.
- Momentum indicators show a strong bullish momentum but also hint at potential overbought conditions.
- Volatility indicators suggest decreasing volatility and a possible period of consolidation.
- Volume indicators reflect mixed buying and selling pressure, with a slight decrease in buying interest.
Conclusion:
Based on the analysis of the technical indicators, the next few days for JMSI stock price movement could see further upside potential in the short term. However, caution is advised as some momentum indicators signal potential overbought conditions, which might lead to a temporary pullback or consolidation. Traders should closely monitor key support and resistance levels to navigate potential price fluctuations. Overall, the outlook remains bullish with a possibility of sideways movement in the near future.