Technical Analysis of JGRO 2024-05-10
Overview:
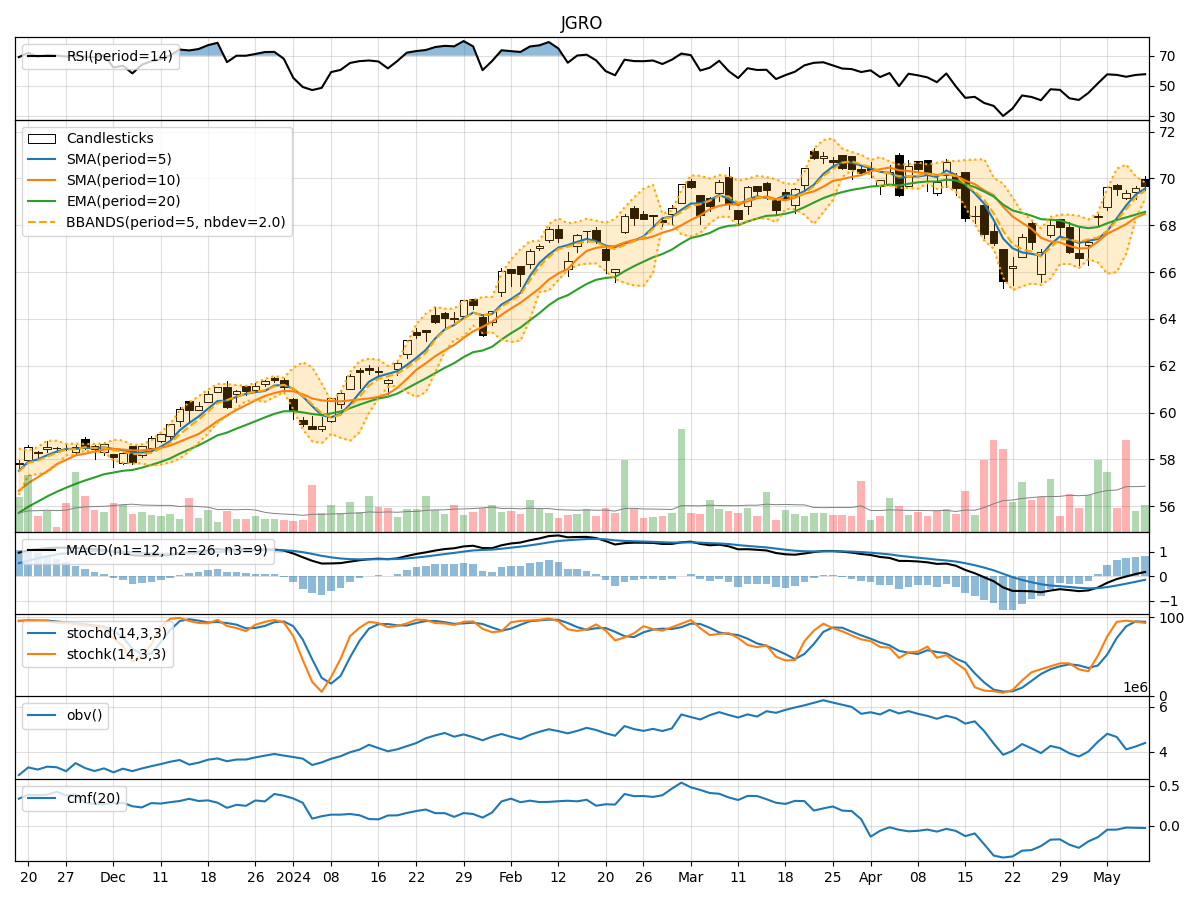
In analyzing the technical indicators for JGRO over the last 5 days, we will delve into the trend, momentum, volatility, and volume indicators to provide a comprehensive outlook on the possible stock price movement in the coming days.
Trend Analysis:
- Moving Averages (MA): The 5-day Moving Average (MA) has been consistently above the Simple Moving Average (SMA) and Exponential Moving Average (EMA), indicating a bullish trend.
- MACD: The MACD line has been consistently above the signal line, with the MACD histogram showing an increasing positive trend, further supporting a bullish sentiment.
Momentum Analysis:
- RSI: The Relative Strength Index (RSI) has been hovering around the 50 level, indicating a neutral momentum in the stock.
- Stochastic Oscillator: Both %K and %D have been in the overbought zone, suggesting a potential reversal or consolidation in the stock price.
- Williams %R: The Williams %R is in the oversold territory, signaling a possible bullish reversal.
Volatility Analysis:
- Bollinger Bands: The stock price has been trading within the Bollinger Bands, with the bands narrowing, indicating decreasing volatility.
- Bollinger %B: The %B indicator is hovering around 0.7, suggesting a neutral stance in terms of volatility.
Volume Analysis:
- On-Balance Volume (OBV): The OBV has been fluctuating, indicating indecision among investors regarding the stock.
- Chaikin Money Flow (CMF): The CMF has been negative, suggesting that money is flowing out of the stock.
Conclusion:
Based on the analysis of the technical indicators, the stock of JGRO is currently in a consolidation phase with a neutral to slightly bullish bias. The trend indicators point towards a bullish sentiment, supported by the moving averages and MACD. However, the momentum indicators suggest a potential reversal or consolidation in the short term, as indicated by the overbought Stochastic Oscillator and oversold Williams %R.
The volatility indicators show a decrease in volatility, which could lead to a period of sideways movement. The volume indicators reflect indecision among investors, with money flowing out of the stock according to the CMF.
Therefore, the next few days may see sideways movement with a slight bullish bias in the stock price of JGRO. Traders should closely monitor key support and resistance levels for potential breakout opportunities.