Technical Analysis of JEPY 2024-05-10
Overview:
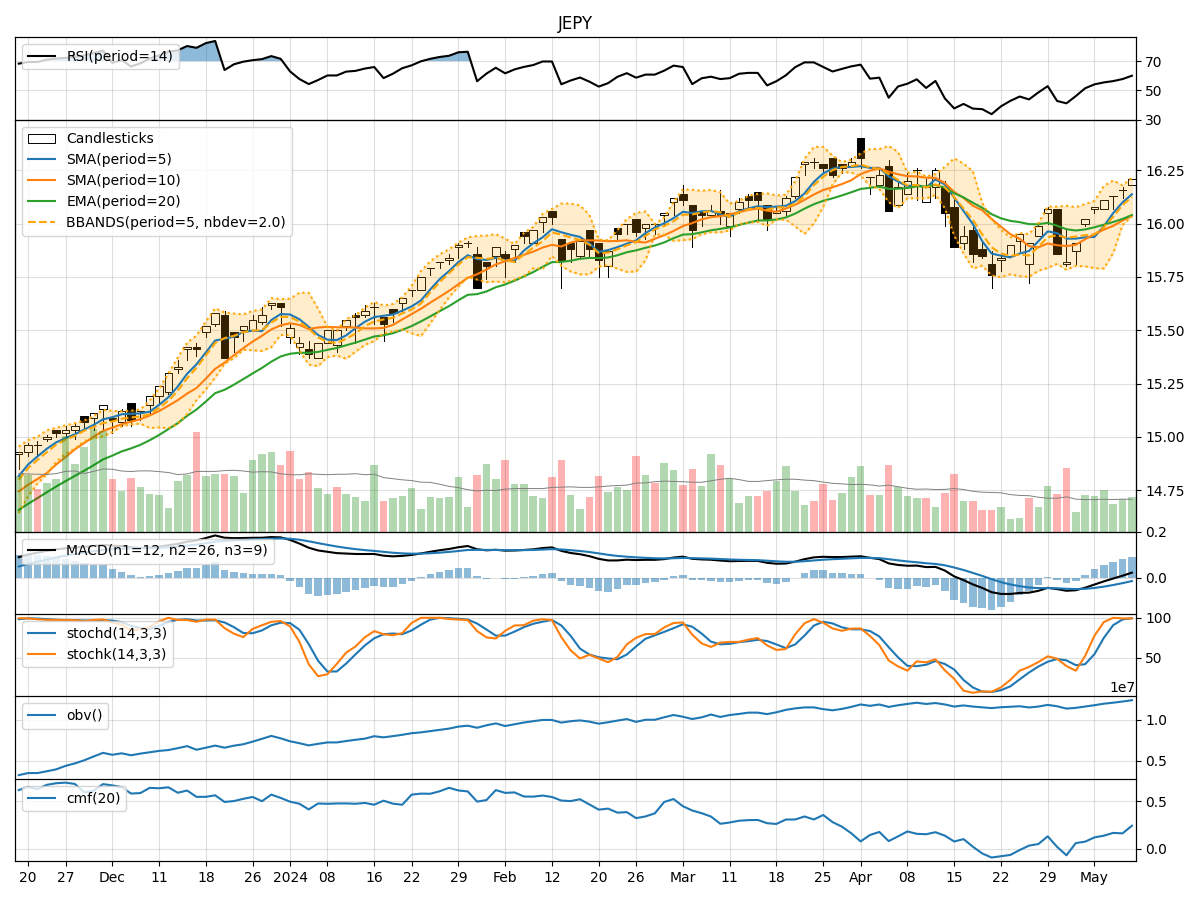
In analyzing the technical indicators for JEPY stock over the last 5 days, we will delve into the trend, momentum, volatility, and volume indicators to provide a comprehensive outlook on the possible stock price movement in the coming days. By examining these key indicators, we aim to offer valuable insights and predictions for potential investors.
Trend Analysis:
- Moving Averages (MA): The 5-day Moving Average (MA) has been consistently rising, indicating a bullish trend in the short term.
- MACD: The MACD line has been trending upwards, crossing above the signal line, suggesting a bullish momentum.
- RSI: The Relative Strength Index (RSI) has been increasing, showing strengthening buying pressure.
Key Observation: The trend indicators point towards a bullish sentiment in the stock price movement.
Momentum Analysis:
- Stochastic Oscillator: Both %K and %D have been hovering near or at 100, indicating strong upward momentum.
- Williams %R: The Williams %R is close to oversold levels, suggesting a potential reversal in the short term.
Key Observation: Momentum indicators reflect a strong bullish sentiment in the stock.
Volatility Analysis:
- Bollinger Bands: The stock price has been trading within the upper Bollinger Band, indicating an overbought condition.
- Volatility Bands: The volatility has been relatively stable, with the bands not showing significant expansion or contraction.
Key Observation: Volatility indicators suggest a potential consolidation phase in the stock price.
Volume Analysis:
- On-Balance Volume (OBV): The OBV has been steadily increasing, indicating strong buying volume.
- Chaikin Money Flow (CMF): The CMF has been positive, reflecting buying pressure in the stock.
Key Observation: Volume indicators signal bullish sentiment in the stock.
Conclusion:
Based on the analysis of trend, momentum, volatility, and volume indicators, the overall outlook for JEPY stock is strongly bullish. The trend is positive, momentum is robust, and volume is supportive of further price appreciation. However, the stock might experience a short-term consolidation phase due to overbought conditions indicated by the Bollinger Bands.
Therefore, the next few days are likely to see a continuation of the bullish trend with a possibility of a short-term consolidation before potential further upside movement. Investors should consider entering positions strategically during consolidation phases to capitalize on the overall bullish momentum in JEPY stock.