Technical Analysis of JEPQ 2024-05-10
Overview:
In analyzing the technical indicators for JEPQ stock over the last 5 days, we will delve into the trend, momentum, volatility, and volume indicators to provide a comprehensive outlook on the possible stock price movement in the coming days. By examining these key indicators, we aim to offer valuable insights and recommendations for potential investors.
Trend Analysis:
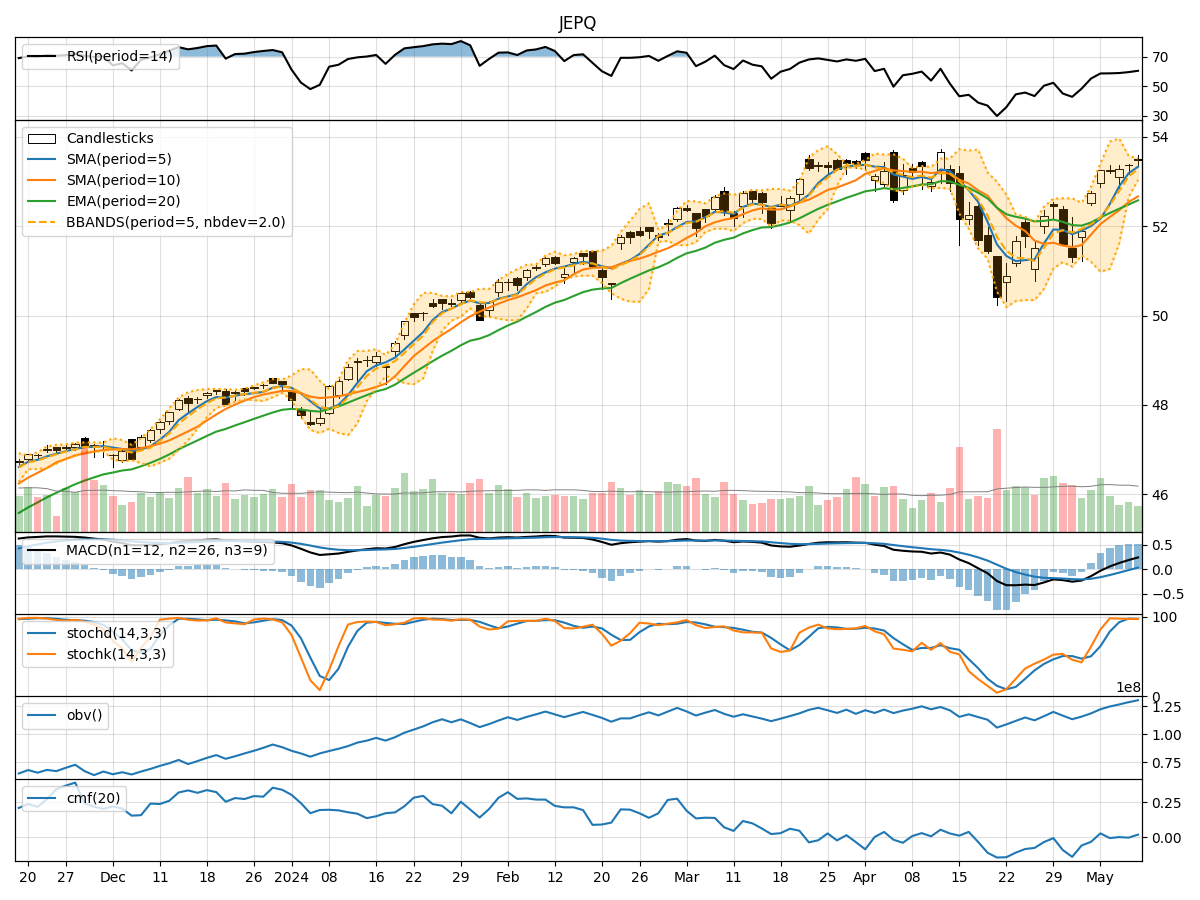
- Moving Averages (MA): The 5-day Moving Average (MA) has been consistently trending upwards, indicating a positive momentum in the stock price.
- MACD: The MACD line has been above the signal line for the past 5 days, suggesting a bullish trend in the stock.
- EMA: The Exponential Moving Average (EMA) has also been on an upward trajectory, supporting the bullish sentiment in the stock.
Momentum Analysis:
- RSI: The Relative Strength Index (RSI) has been increasing steadily, reaching overbought levels, which could signal a potential reversal or consolidation in the stock price.
- Stochastic Oscillator: Both %K and %D lines of the Stochastic Oscillator have been in the overbought zone, indicating a possible pullback in the stock price.
- Williams %R: The Williams %R indicator has been in the oversold territory, suggesting a potential reversal in the stock price.
Volatility Analysis:
- Bollinger Bands: The Bollinger Bands have been narrowing, indicating decreasing volatility in the stock price.
- Bollinger %B: The %B indicator has been hovering around 1, suggesting that the stock price is trading close to the upper Bollinger Band.
Volume Analysis:
- On-Balance Volume (OBV): The OBV indicator has been trending upwards, indicating accumulation of the stock by investors.
- Chaikin Money Flow (CMF): The CMF has been positive over the last 5 days, suggesting buying pressure in the stock.
Conclusion:
Based on the analysis of the technical indicators, the stock of JEPQ is currently exhibiting overbought conditions in terms of momentum indicators like RSI and Stochastic Oscillator. The narrowing Bollinger Bands and the stock trading close to the upper band also suggest a potential pullback or consolidation in the stock price in the coming days. Additionally, the increasing OBV and positive CMF indicate accumulation by investors, which could provide support to the stock price.
Recommendation:
Considering the overbought conditions and the potential for a pullback indicated by the technical indicators, it is advisable to exercise caution in entering new long positions at the current levels. Traders may consider taking profits on existing positions or implementing risk management strategies to protect gains. Monitoring the stock price for signs of a reversal or consolidation would be prudent before considering new entry points.
Disclaimer:
This analysis is based solely on technical indicators and historical data, and it is important to note that market dynamics can change rapidly. It is recommended to conduct thorough research, consider fundamental factors, and consult with a financial advisor before making any investment decisions.