Technical Analysis of IYW 2024-05-10
Overview:
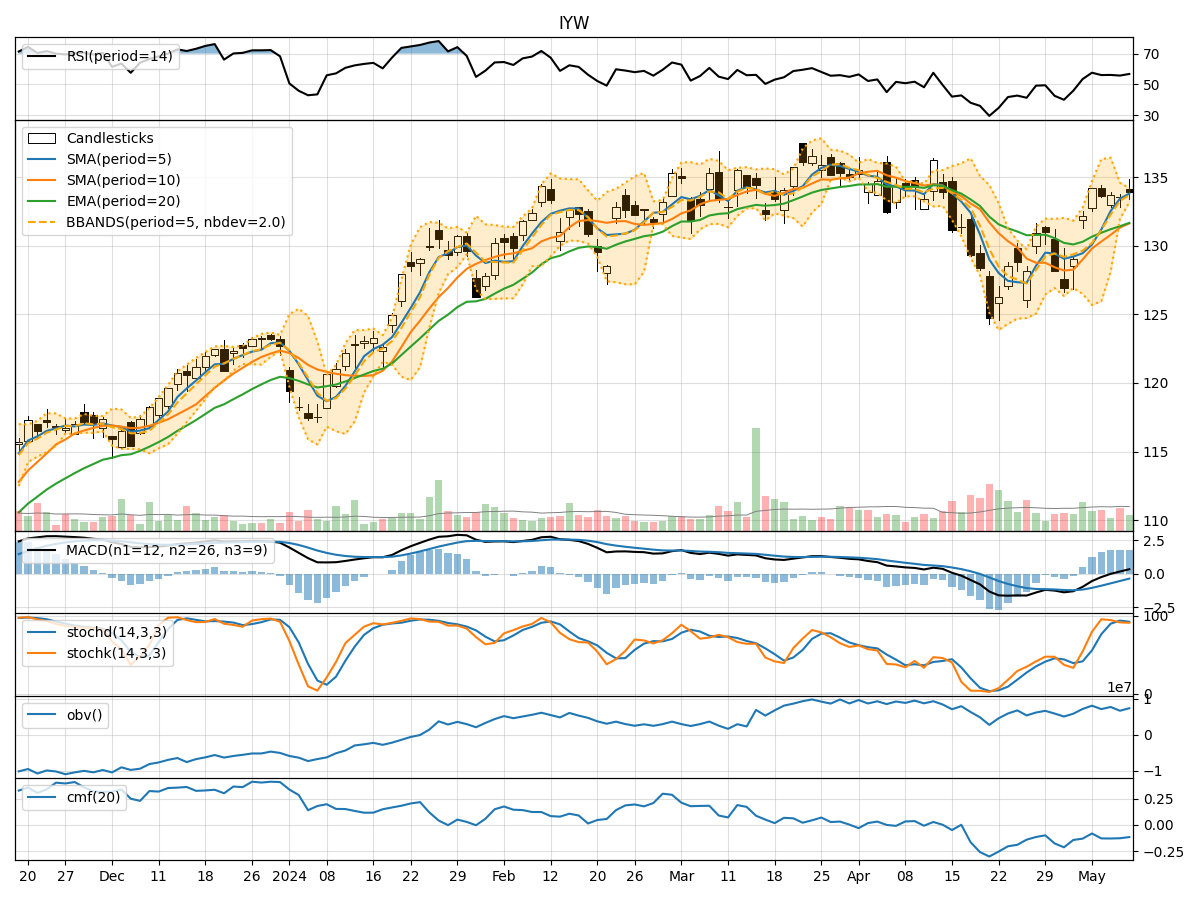
In analyzing the technical indicators for IYW over the last 5 days, we will delve into the trend, momentum, volatility, and volume indicators to provide a comprehensive outlook on the possible stock price movement in the coming days.
Trend Analysis:
- Moving Averages (MA): The 5-day Moving Average has been consistently above the Simple Moving Average (SMA) and Exponential Moving Average (EMA), indicating a bullish trend.
- MACD: The MACD line has been consistently above the signal line, with both lines showing an upward trend, suggesting bullish momentum.
Momentum Analysis:
- RSI: The Relative Strength Index (RSI) has been fluctuating around the 50 level, indicating a neutral momentum.
- Stochastic Oscillator: Both %K and %D have been in the overbought zone, suggesting a potential reversal or consolidation.
Volatility Analysis:
- Bollinger Bands (BB): The stock price has been trading within the bands, with the bands narrowing, indicating decreasing volatility.
Volume Analysis:
- On-Balance Volume (OBV): The OBV has been fluctuating, indicating indecision among investors.
- Chaikin Money Flow (CMF): The CMF has been negative, suggesting selling pressure in the market.
Key Observations:
- The trend indicators suggest a bullish sentiment in the short term.
- Momentum indicators show a neutral stance with a potential for a reversal.
- Volatility is decreasing, indicating a possible period of consolidation.
- Volume indicators reflect indecision and selling pressure in the market.
Conclusion:
Based on the analysis of the technical indicators, the next few days' possible stock price movement for IYW could be sideways with a slight bullish bias. The bullish trend indicated by moving averages and MACD may support some upward movement, but the neutral momentum and selling pressure reflected in the momentum and volume indicators could limit significant gains. Additionally, the decreasing volatility suggests a period of consolidation where the stock price may trade within a narrow range.
Recommendation:
- Short-term Traders: Consider taking advantage of potential small bullish movements but be cautious of the neutral momentum and selling pressure.
- Long-term Investors: Monitor the stock closely for any signs of a trend reversal or significant developments that could impact the stock price.
Always remember to conduct further research and consider fundamental factors before making any investment decisions.