Technical Analysis of IYG 2024-05-10
Overview:
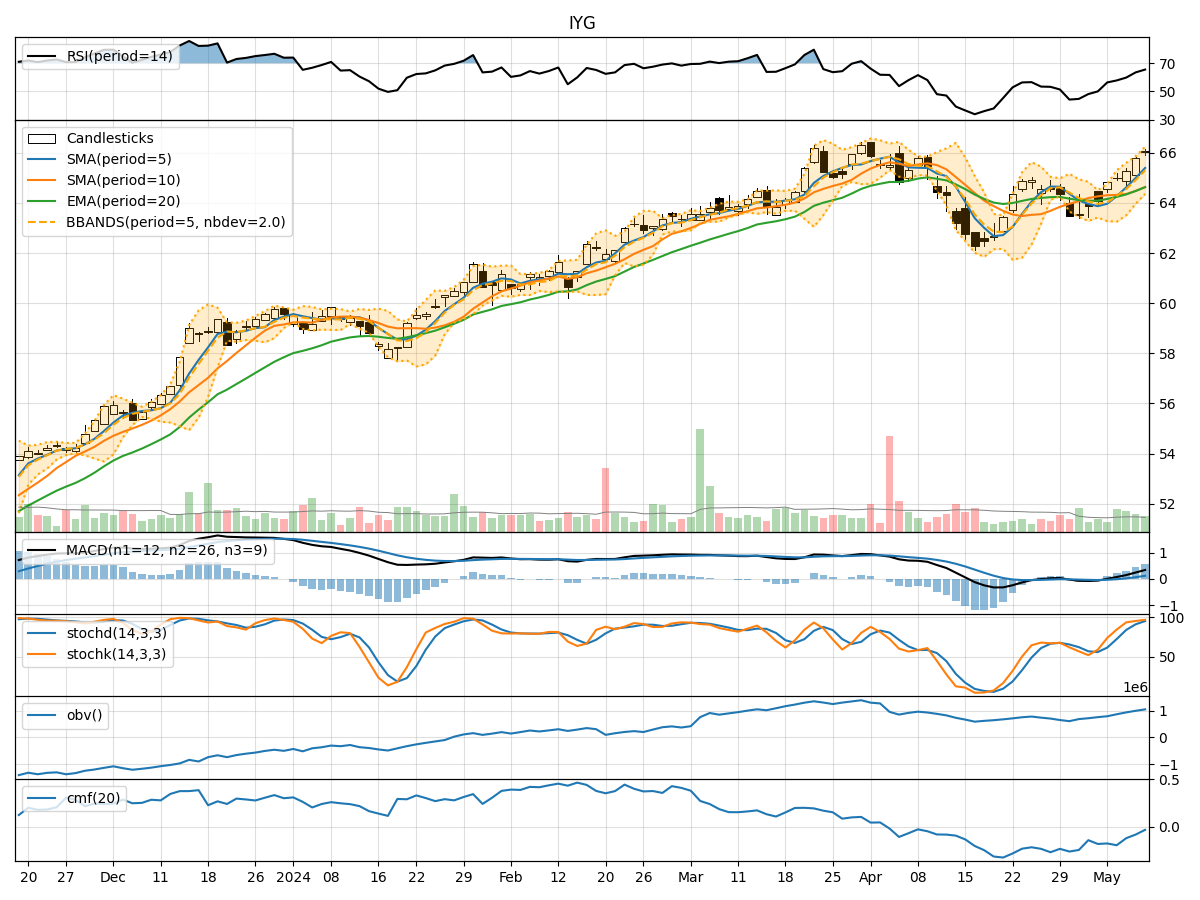
In analyzing the technical indicators for IYG over the last 5 days, we will delve into the trend, momentum, volatility, and volume indicators to provide a comprehensive outlook on the possible stock price movement. By examining these key indicators, we aim to offer valuable insights and predictions for the upcoming days.
Trend Indicators:
- Moving Averages (MA): The 5-day MA has been consistently rising, indicating a bullish trend in the short term.
- MACD: The MACD line has been increasing, crossing above the signal line, suggesting a bullish momentum.
- RSI: The RSI is in the overbought territory, indicating a strong bullish momentum.
Key Observation: The trend indicators suggest a strong bullish sentiment in the stock.
Momentum Indicators:
- Stochastic Oscillator: Both %K and %D are in the overbought zone, signaling a potential reversal or consolidation.
- Williams %R: The indicator is in the oversold region, hinting at a possible reversal in the short term.
Key Observation: Momentum indicators show conflicting signals, with stochastic oscillator indicating overbought conditions and Williams %R suggesting oversold levels.
Volatility Indicators:
- Bollinger Bands (BB): The bands have been widening, indicating increased volatility in the stock.
- BB %B: The %B is below 1, suggesting the stock is trading below the lower Bollinger Band.
Key Observation: Volatility has been on the rise, potentially leading to larger price swings in the near future.
Volume Indicators:
- On-Balance Volume (OBV): The OBV has been steadily increasing, indicating accumulation by investors.
- Chaikin Money Flow (CMF): The CMF is negative, suggesting a bearish money flow trend.
Key Observation: While OBV shows positive accumulation, CMF indicates a bearish money flow trend.
Conclusion:
Based on the analysis of the technical indicators, the stock is currently exhibiting a strong bullish trend supported by the moving averages and MACD. However, conflicting signals from momentum indicators like the stochastic oscillator and Williams %R suggest a potential consolidation or reversal in the short term. The increasing volatility, as indicated by the widening Bollinger Bands, could lead to larger price swings ahead. The positive OBV signals accumulation, but the negative CMF points to a bearish money flow trend.
Recommendation:
Considering the overall analysis, it is advisable to exercise caution in the current market environment. Traders may consider taking profits on existing positions due to the potential for a consolidation or reversal. Investors should closely monitor the stock's price action and key support/resistance levels to make informed decisions. It is crucial to stay vigilant and adapt to changing market conditions to navigate potential risks effectively.