Technical Analysis of IXN 2024-05-10
Overview:
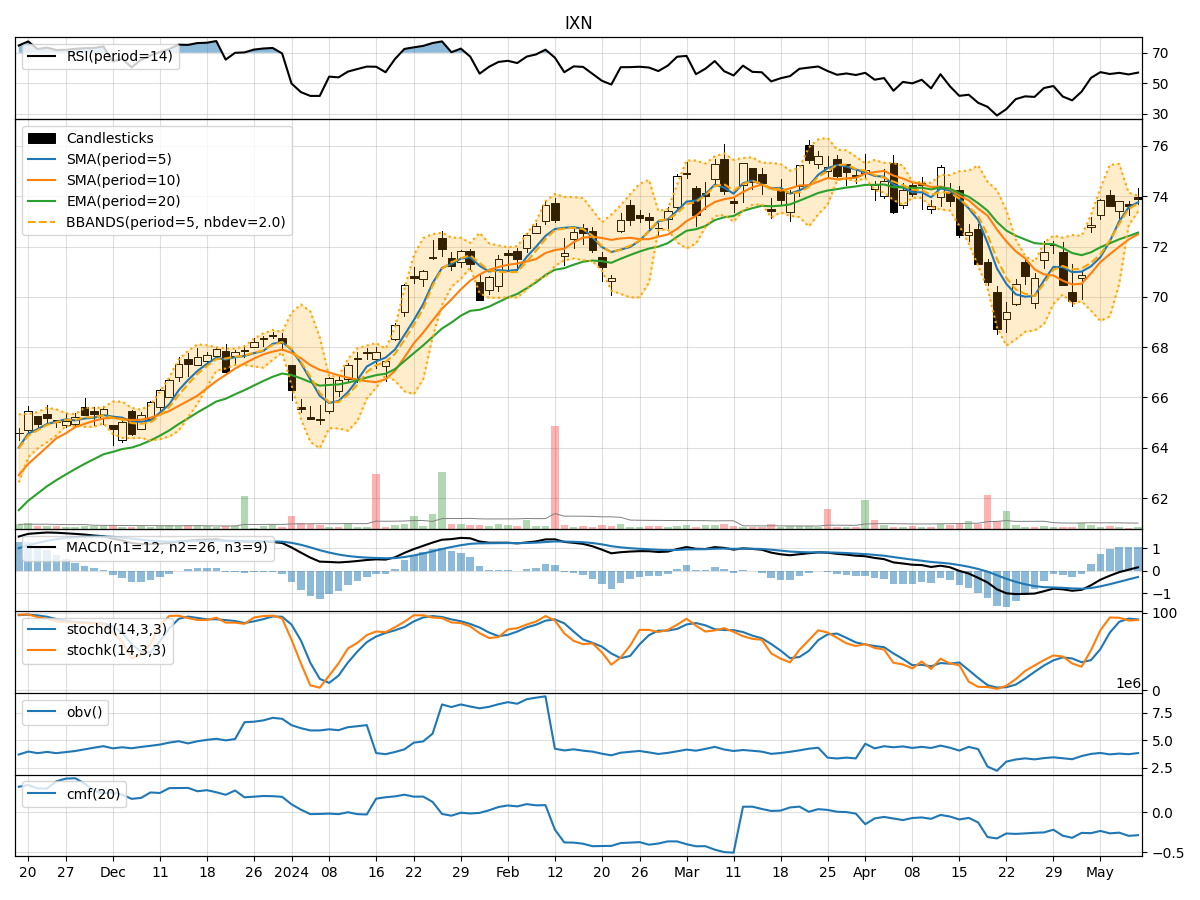
In analyzing the technical indicators for IXN over the last 5 days, we will delve into the trend, momentum, volatility, and volume indicators to provide a comprehensive outlook on the possible stock price movement in the coming days. By examining these key aspects, we aim to offer valuable insights and predictions for potential investors.
Trend Indicators:
- Moving Averages (MA): The 5-day MA has been consistently above the longer-term SMAs and EMAs, indicating a bullish trend.
- MACD: The MACD line has been trending upwards, with the MACD histogram showing positive values, suggesting bullish momentum.
- Conclusion: The trend indicators point towards an upward trend in the stock price.
Momentum Indicators:
- RSI: The RSI has been fluctuating around the neutral zone, indicating a lack of strong momentum.
- Stochastic Oscillator: Both %K and %D have been in the overbought territory, suggesting a potential reversal.
- Conclusion: The momentum indicators signal a neutral stance with a possibility of a bearish reversal.
Volatility Indicators:
- Bollinger Bands (BB): The stock price has been trading within the bands, indicating moderate volatility.
- Conclusion: Volatility remains stable with no significant deviations from the bands.
Volume Indicators:
- On-Balance Volume (OBV): The OBV has been fluctuating, indicating mixed buying and selling pressure.
- Chaikin Money Flow (CMF): The CMF has been negative, suggesting a lack of strong buying interest.
- Conclusion: Volume indicators reflect mixed sentiment with no clear direction.
Conclusion:
Based on the analysis of the technical indicators, the stock price of IXN is likely to experience mixed movements in the coming days. While the trend indicators suggest an upward trajectory, the momentum indicators hint at a potential bearish reversal. Volatility remains stable, and volume indicators show mixed sentiment.
Recommendation:
Considering the conflicting signals from the indicators, investors should exercise caution and closely monitor the price action. It is advisable to wait for more clarity in the market dynamics before making significant trading decisions. Stay vigilant for any potential shifts in momentum and volume that could influence the stock price movement.
Disclaimer:
Remember that technical analysis is not a guaranteed predictor of future price movements, and other fundamental factors can impact stock prices. It is crucial to conduct thorough research and consider multiple indicators before making investment decisions. Consulting with a financial advisor is recommended for personalized guidance tailored to your investment goals and risk tolerance level.