Technical Analysis of IWY 2024-05-10
Overview:
In analyzing the technical indicators for IWY over the last 5 days, we will delve into the trend, momentum, volatility, and volume indicators to provide a comprehensive outlook on the possible stock price movement in the coming days.
Trend Analysis:
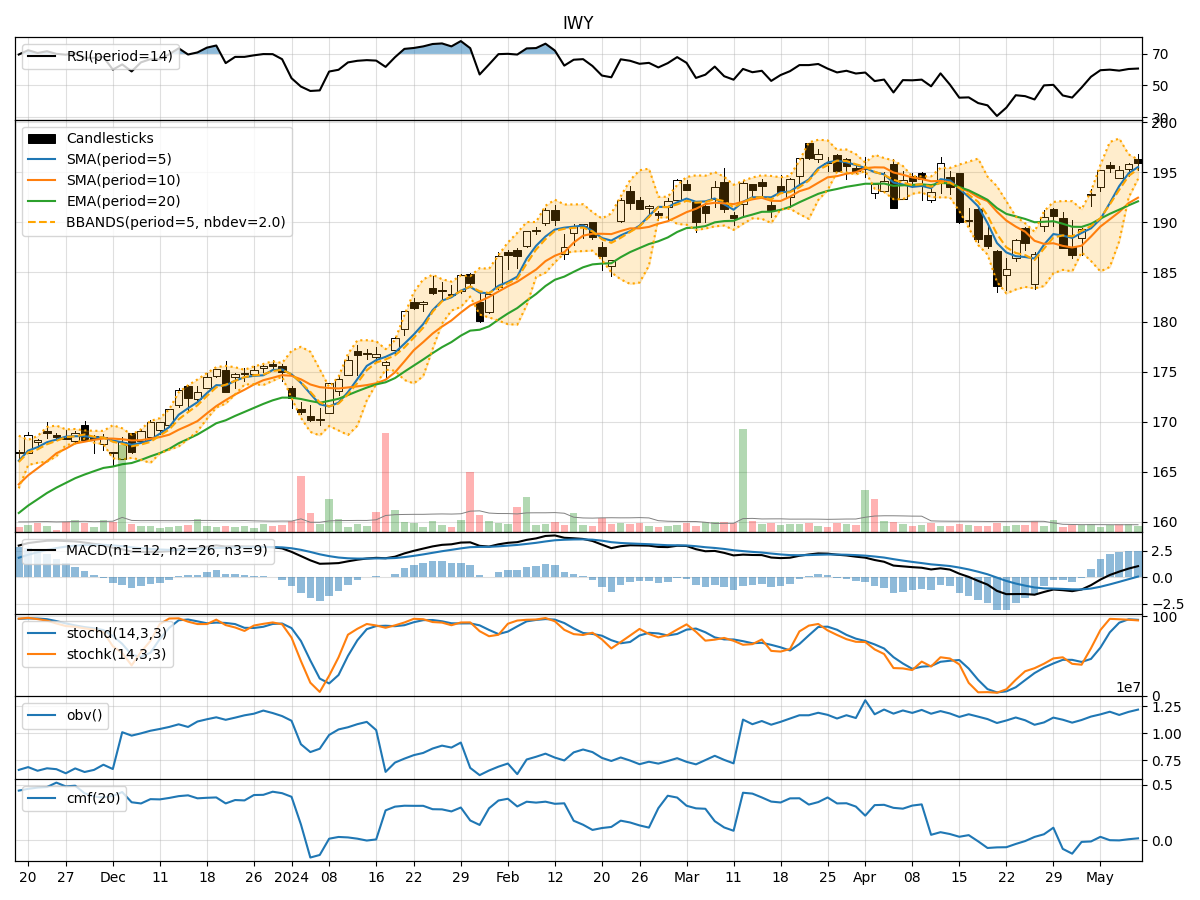
- Moving Averages (MA): The 5-day Moving Average (MA) has been consistently rising, indicating a bullish trend.
- MACD: The MACD line has been above the signal line, suggesting a bullish momentum.
- EMA: The Exponential Moving Average (EMA) has also been trending upwards, supporting the bullish sentiment.
Momentum Analysis:
- RSI: The Relative Strength Index (RSI) has been in the neutral zone, indicating neither overbought nor oversold conditions.
- Stochastic Oscillator: Both %K and %D have been relatively high, signaling strong buying momentum.
- Williams %R: The Williams %R is in the oversold territory, suggesting a potential reversal.
Volatility Analysis:
- Bollinger Bands: The stock price has been trading within the Bollinger Bands, indicating a period of consolidation.
- Bollinger %B: The %B indicator shows the stock price is currently near the upper band, suggesting a possible overbought condition.
Volume Analysis:
- On-Balance Volume (OBV): The OBV has been increasing, indicating accumulation by investors.
- Chaikin Money Flow (CMF): The CMF has been positive, reflecting buying pressure in the stock.
Key Observations:
- The trend indicators suggest a strong bullish sentiment with rising moving averages and positive MACD.
- Momentum indicators show mixed signals with RSI in a neutral zone but stochastic indicators indicating strong buying momentum.
- Volatility indicators point towards a period of consolidation within the Bollinger Bands.
- Volume indicators reflect positive accumulation and buying pressure in the stock.
Conclusion:
Based on the analysis of the technical indicators, the next few days' possible stock price movement for IWY is likely to continue in an upward direction. The bullish trend supported by moving averages and MACD, along with positive volume indicators, indicates a favorable outlook for the stock. However, caution should be exercised as the stock may be nearing overbought levels based on the Bollinger Bands %B indicator. Traders and investors should monitor the price action closely for any signs of a potential reversal.