Technical Analysis of IWFL 2024-05-10
Overview:
In analyzing the technical indicators for IWFL over the last 5 days, we will delve into the trend, momentum, volatility, and volume indicators to provide a comprehensive outlook on the possible stock price movement. By examining these key indicators, we aim to offer valuable insights and predictions for the upcoming days.
Trend Indicators:
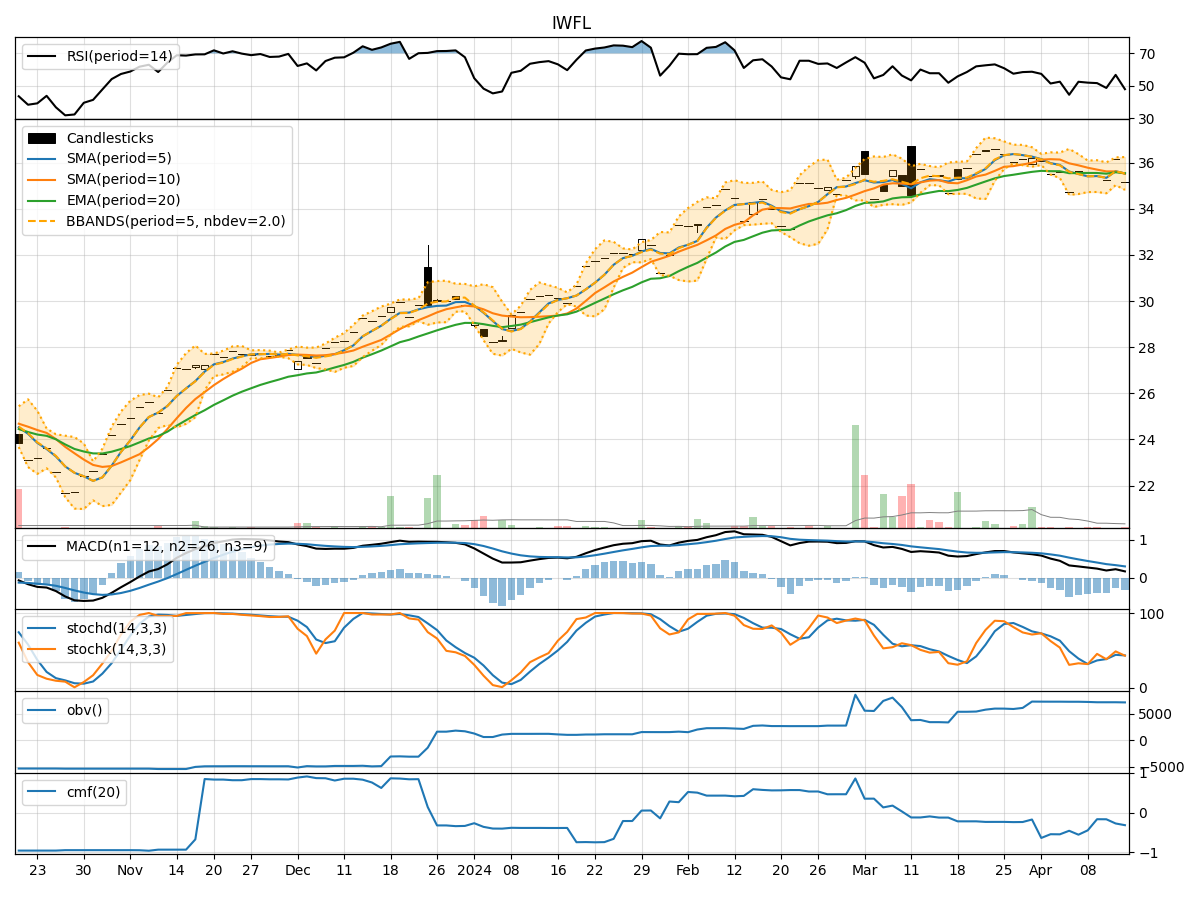
- Moving Averages (MA): The 5-day Moving Average has been consistently above the Simple Moving Average (SMA) and Exponential Moving Average (EMA), indicating a bullish trend.
- MACD: The MACD line has been consistently above the signal line, with both lines showing an upward trend, suggesting bullish momentum.
- MACD Histogram: The MACD Histogram has been increasing over the last 5 days, indicating strengthening bullish momentum.
Momentum Indicators:
- RSI: The Relative Strength Index (RSI) has been trending upwards and is currently in the overbought territory, suggesting a strong bullish momentum.
- Stochastic Oscillator: Both %K and %D lines of the Stochastic Oscillator have been consistently high, indicating strong bullish momentum.
- Williams %R: The Williams %R is consistently at 0, indicating an overbought condition.
Volatility Indicators:
- Bollinger Bands: The stock price has been trading within the Bollinger Bands, with the bands narrowing over the last 5 days, suggesting decreasing volatility.
- Bollinger %B: The %B indicator is above 0.5, indicating a bullish trend.
Volume Indicators:
- On-Balance Volume (OBV): The OBV has been fluctuating but has not shown a clear trend, indicating mixed buying and selling pressure.
- Chaikin Money Flow (CMF): The CMF has been consistently negative, suggesting a lack of buying pressure.
Key Observations:
- The trend indicators, momentum indicators, and volatility indicators all point towards a bullish outlook for IWFL.
- The stock is currently in an overbought condition based on the RSI and Stochastic Oscillator readings.
- The narrowing Bollinger Bands suggest a period of consolidation before a potential breakout.
- The volume indicators show mixed signals, with the OBV fluctuating and the CMF indicating a lack of buying pressure.
Conclusion:
Based on the analysis of the technical indicators, the next few days for IWFL are likely to see a continuation of the bullish trend with a possibility of consolidation before a potential breakout. Traders should be cautious of the overbought conditions indicated by the RSI and Stochastic Oscillator and monitor for any signs of reversal. Overall, the stock shows strength in its trend and momentum, but caution is advised due to the mixed signals in volume indicators.