Technical Analysis of IWD 2024-05-10
Overview:
In analyzing the technical indicators for IWD over the last 5 days, we will delve into the trend, momentum, volatility, and volume indicators to provide a comprehensive outlook on the possible stock price movement in the coming days.
Trend Analysis:
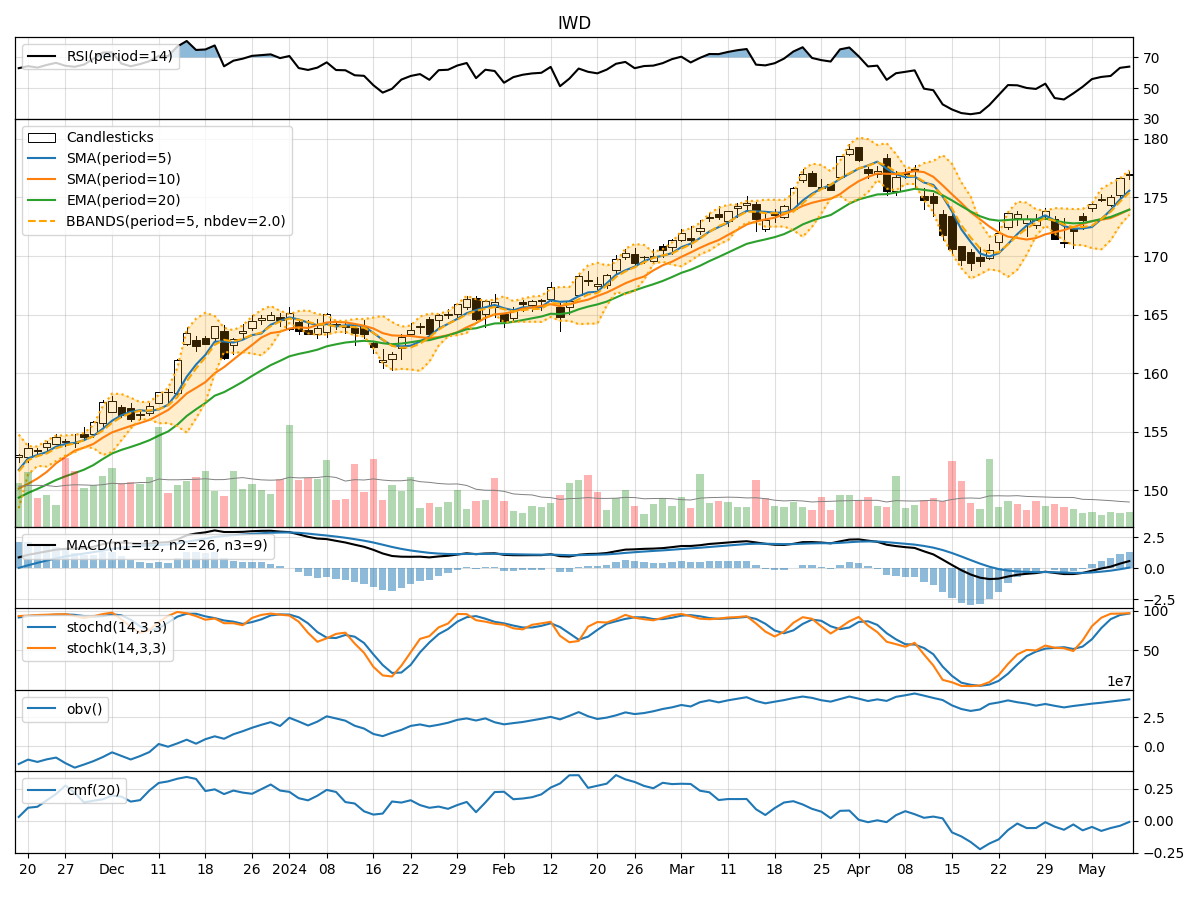
- Moving Averages (MA): The 5-day Moving Average (MA) has been consistently rising, indicating a bullish trend in the short term.
- MACD: The MACD line has been above the signal line for the past 5 days, suggesting a bullish momentum.
- EMA: The Exponential Moving Average (EMA) has also been trending upwards, supporting the bullish sentiment.
Momentum Analysis:
- RSI: The Relative Strength Index (RSI) has been increasing, showing strengthening momentum.
- Stochastic Oscillator: Both %K and %D have been in overbought territory, indicating a strong bullish momentum.
- Williams %R: The Williams %R is in oversold territory, suggesting a potential reversal.
Volatility Analysis:
- Bollinger Bands: The stock price has been consistently trading above the middle Bollinger Band, indicating an uptrend.
- Bollinger Band Width: The Band Width has been narrowing, suggesting a decrease in volatility.
- Bollinger %B: The %B indicator has been above 0.5, indicating bullish momentum.
Volume Analysis:
- On-Balance Volume (OBV): The OBV has been steadily increasing, showing accumulation by investors.
- Chaikin Money Flow (CMF): The CMF has been negative, indicating some selling pressure.
Key Observations:
- The trend indicators, momentum indicators, and volatility indicators all point towards a bullish sentiment in the short term.
- The volume indicators, specifically the CMF, suggest a slight bearish pressure due to negative values.
Conclusion:
Based on the analysis of the technical indicators, the next few days' possible stock price movement for IWD is likely to be upward. The bullish trend, supported by the moving averages, MACD, RSI, and Bollinger Bands, indicates a positive outlook. However, it is essential to monitor the volume indicators closely for any signs of divergence or potential reversal in the bullish trend. Overall, the current technical analysis suggests a bullish bias for the upcoming days.