Technical Analysis of IWB 2024-05-10
Overview:
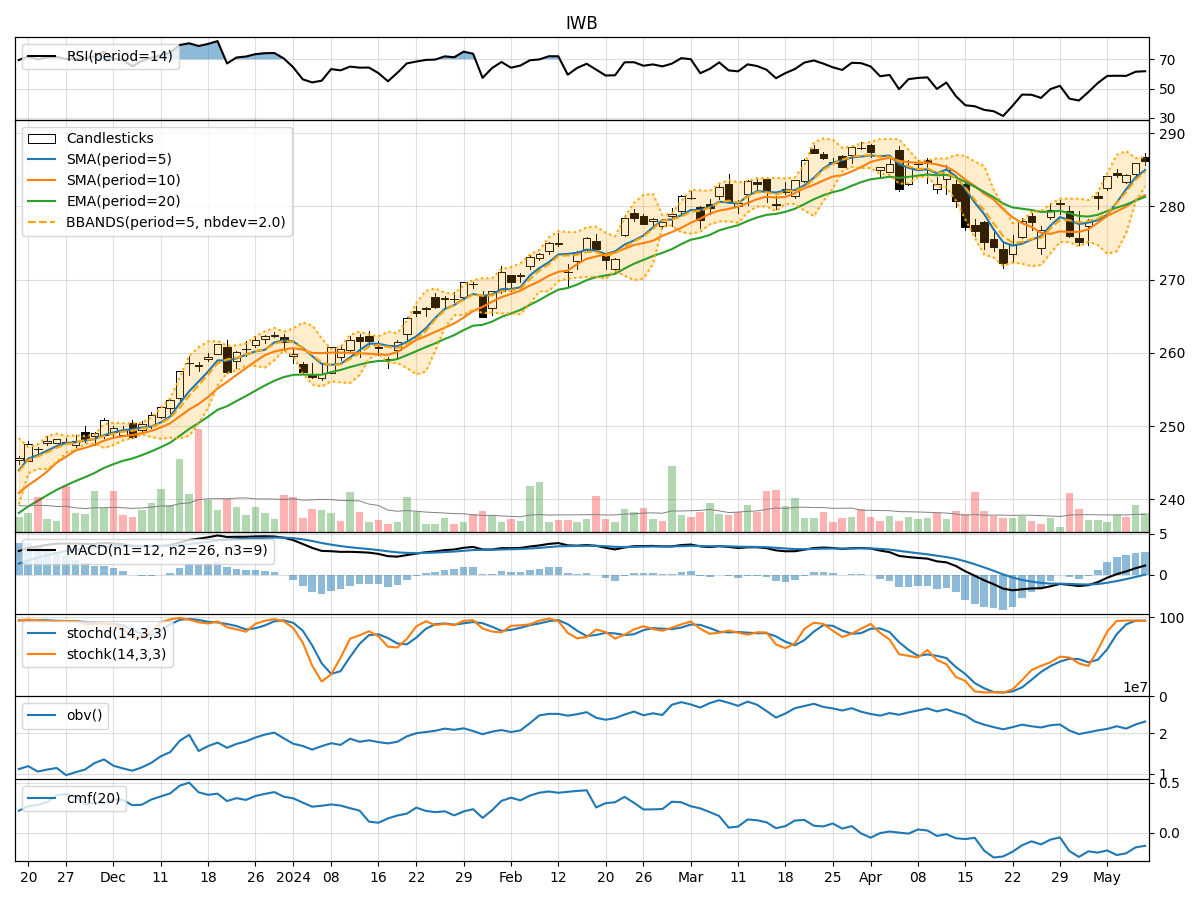
In the last 5 trading days, the stock price of IWB has shown a gradual increase, with the closing price rising from 284.19 to 286.17. Various technical indicators have been analyzed to provide insights into the possible future stock price movement. The analysis includes trend indicators, momentum indicators, volatility indicators, and volume indicators.
Trend Indicators Analysis:
- Moving Averages (MA): The moving averages have been on an upward trend, indicating a positive momentum in the stock price.
- MACD (Moving Average Convergence Divergence): The MACD and signal line have been consistently increasing, suggesting a bullish trend.
- RSI (Relative Strength Index): The RSI values have been in the neutral to slightly overbought territory, indicating potential strength in the current uptrend.
Momentum Indicators Analysis:
- Stochastic Oscillator: The stochastic oscillator has been in the overbought region, suggesting a potential reversal or consolidation in the near future.
- Williams %R (Willams Percentage Range): The Williams %R values have been fluctuating around the oversold region, indicating a possible reversal or correction.
Volatility Indicators Analysis:
- Bollinger Bands: The Bollinger Bands have been narrowing, indicating decreasing volatility and a potential breakout or significant price movement in the near future.
Volume Indicators Analysis:
- On-Balance Volume (OBV): The OBV has shown mixed signals, with some days indicating selling pressure and others showing buying interest.
- Chaikin Money Flow (CMF): The CMF has been negative, suggesting a lack of strong buying pressure in the stock.
Key Observations and Opinions:
- Trend: The overall trend based on moving averages and MACD is bullish, indicating a potential continuation of the upward momentum.
- Momentum: The stochastic oscillator and Williams %R suggest a potential reversal or consolidation due to overbought conditions.
- Volatility: The narrowing Bollinger Bands indicate a potential breakout or significant price movement in the near future.
- Volume: The mixed signals from OBV and negative CMF suggest uncertainty in terms of buying pressure.
Conclusion:
Based on the analysis of the technical indicators, the next few days' possible stock price movement for IWB is likely to see further upward movement in the short term, supported by the bullish trend indicators. However, caution is advised due to the overbought conditions indicated by momentum indicators, which could lead to a temporary consolidation or pullback. Traders should closely monitor the Bollinger Bands for a potential breakout and keep an eye on volume indicators for confirmation of buying interest.