Technical Analysis of IVE 2024-05-10
Overview:
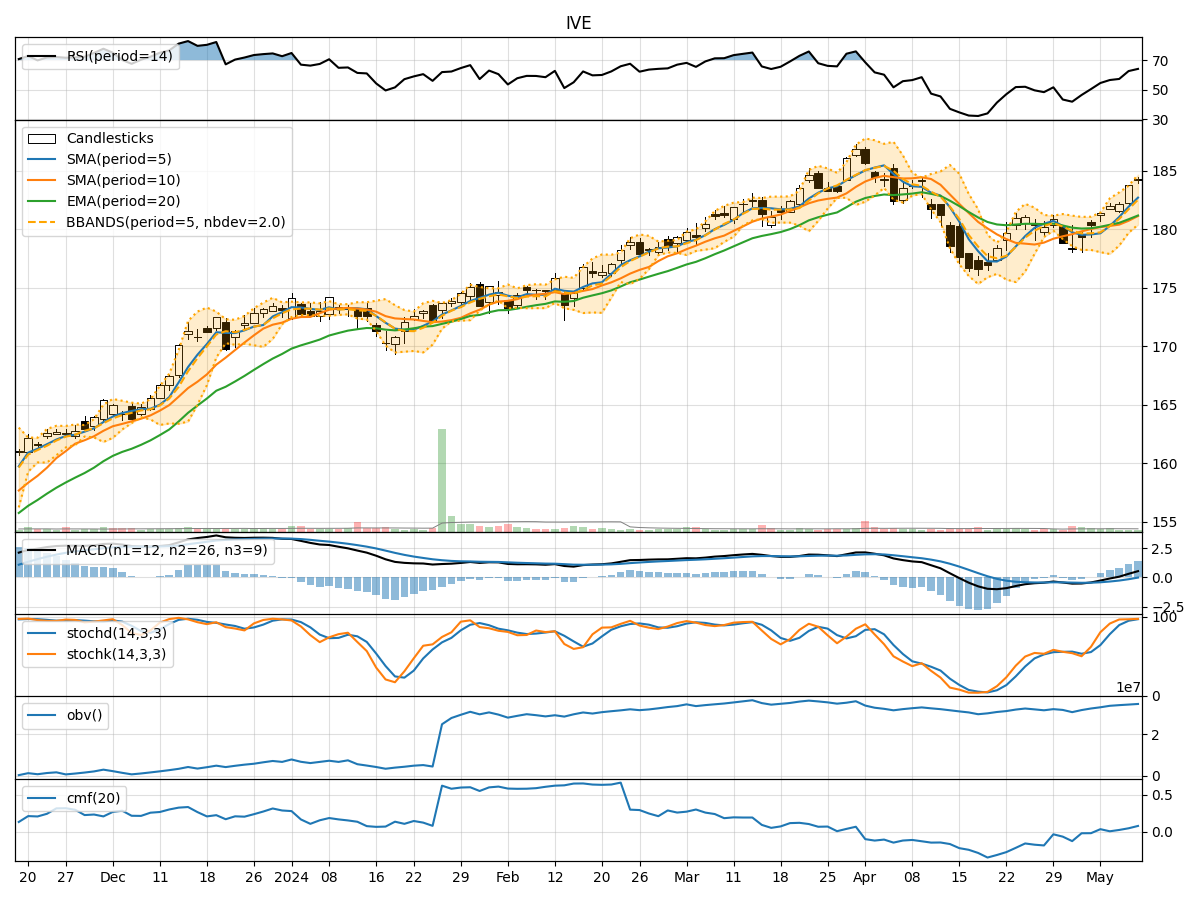
In the last 5 trading days, IVE stock has shown a consistent uptrend in both price and volume. The moving averages have been steadily increasing, indicating a bullish trend. Momentum indicators such as RSI and Stochastic oscillators suggest the stock is in overbought territory but still has room for further upside potential. Volatility indicators like Bollinger Bands show a narrowing range, potentially signaling a period of consolidation before a potential breakout. Volume indicators also confirm the bullish sentiment with increasing On-Balance Volume (OBV) and Chaikin Money Flow (CMF) values.
Trend Analysis:
- Moving Averages (MA): The 5-day MA has been consistently above the 10-day SMA, indicating a short-term bullish trend. The EMA(20) has also been rising steadily, supporting the bullish momentum.
- MACD: The MACD line has been above the signal line for the past few days, indicating positive momentum. The MACD histogram has been increasing, suggesting strengthening bullish momentum.
Momentum Analysis:
- RSI: The RSI has been trending upwards but is approaching overbought levels. This could indicate a potential pullback or consolidation in the short term.
- Stochastic Oscillators: Both %K and %D lines are in the overbought zone, suggesting a possible reversal or consolidation in the near future.
Volatility Analysis:
- Bollinger Bands (BB): The Bollinger Bands have been narrowing, indicating decreasing volatility. This could precede a period of consolidation before a potential breakout in either direction.
Volume Analysis:
- On-Balance Volume (OBV): The OBV has been steadily increasing, confirming the bullish trend. This suggests that volume is supporting the price movement.
- Chaikin Money Flow (CMF): The CMF has been positive, indicating buying pressure in the stock. This aligns with the increasing price trend.
Conclusion:
Based on the technical indicators and analysis: - Trend: The stock is in a strong upward trend, supported by moving averages and MACD. - Momentum: While momentum indicators suggest overbought conditions, the overall trend remains bullish. - Volatility: The narrowing Bollinger Bands indicate a potential period of consolidation before a breakout. - Volume: Increasing OBV and CMF values support the bullish sentiment.
Overall Assessment:
Given the current technical indicators, the next few days for IVE stock are likely to see further upward movement with a potential period of consolidation before a possible breakout. Traders should monitor the overbought conditions in momentum indicators for signs of a short-term pullback, but the overall trend remains bullish. It is essential to set appropriate stop-loss levels and closely monitor key support and resistance levels for potential trading opportunities.